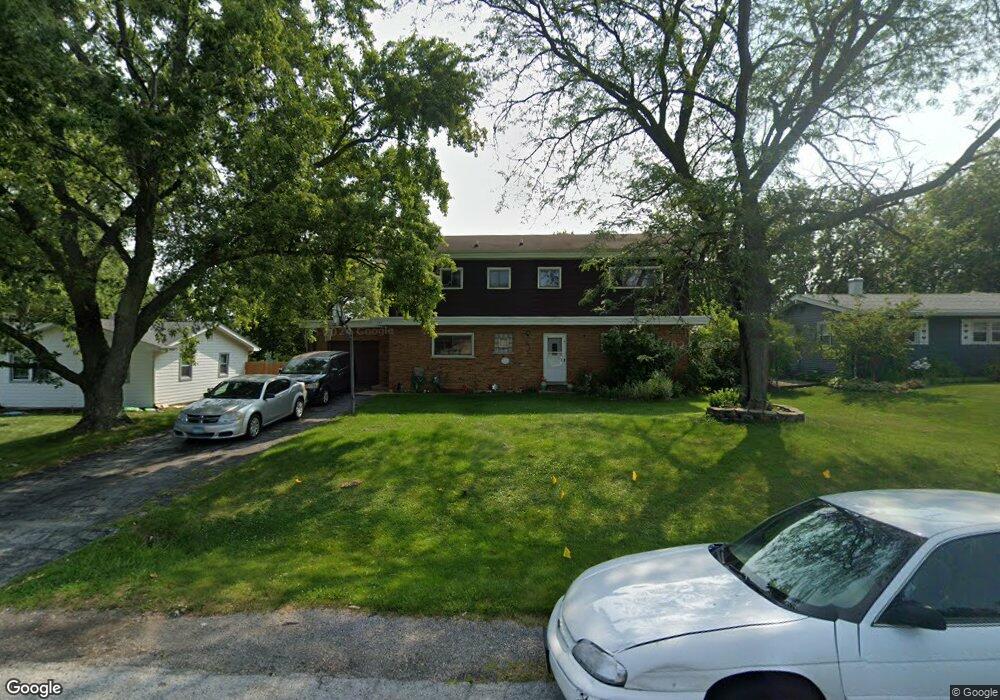
249 Elm St Frankfort, IL 60423
North Frankfort NeighborhoodEstimated Value: $381,950 - $443,000
3
Beds
4
Baths
2,296
Sq Ft
$181/Sq Ft
Est. Value
About This Home
This home is located at 249 Elm St, Frankfort, IL 60423 and is currently estimated at $416,238, approximately $181 per square foot. 249 Elm St is a home located in Will County with nearby schools including Grand Prairie Elementary School, Chelsea Intermediate School, and Hickory Creek Middle School.
Ownership History
Date
Name
Owned For
Owner Type
Purchase Details
Closed on
Dec 11, 1997
Sold by
Tynan Timothy and Tynan Brigid
Bought by
James Robert T and James Theresa
Current Estimated Value
Home Financials for this Owner
Home Financials are based on the most recent Mortgage that was taken out on this home.
Original Mortgage
$120,800
Outstanding Balance
$29,648
Interest Rate
12.2%
Estimated Equity
$386,590
Purchase Details
Closed on
Aug 29, 1997
Sold by
Kohlbacher Marian E and Living Tr Agreement Marian E K
Bought by
Tynan Timothy and Tynan Brigid
Home Financials for this Owner
Home Financials are based on the most recent Mortgage that was taken out on this home.
Original Mortgage
$108,750
Interest Rate
7.57%
Purchase Details
Closed on
Aug 9, 1996
Sold by
Kohlbacher Marian E
Bought by
Kohlbacher Marian E and Marian E Kohlbacher Living Tru
Create a Home Valuation Report for This Property
The Home Valuation Report is an in-depth analysis detailing your home's value as well as a comparison with similar homes in the area
Home Values in the Area
Average Home Value in this Area
Purchase History
| Date | Buyer | Sale Price | Title Company |
|---|---|---|---|
| James Robert T | $151,000 | -- | |
| Tynan Timothy | $112,000 | -- | |
| Kohlbacher Marian E | -- | -- |
Source: Public Records
Mortgage History
| Date | Status | Borrower | Loan Amount |
|---|---|---|---|
| Open | James Robert T | $120,800 | |
| Previous Owner | Tynan Timothy | $108,750 | |
| Closed | James Robert T | $30,200 |
Source: Public Records
Tax History Compared to Growth
Tax History
| Year | Tax Paid | Tax Assessment Tax Assessment Total Assessment is a certain percentage of the fair market value that is determined by local assessors to be the total taxable value of land and additions on the property. | Land | Improvement |
|---|---|---|---|---|
| 2024 | $7,149 | $98,228 | $18,809 | $79,419 |
| 2023 | $7,149 | $87,727 | $16,798 | $70,929 |
| 2022 | $6,272 | $79,904 | $15,300 | $64,604 |
| 2021 | $5,901 | $74,754 | $14,314 | $60,440 |
| 2020 | $5,748 | $72,648 | $13,911 | $58,737 |
| 2019 | $5,558 | $70,704 | $13,539 | $57,165 |
| 2018 | $5,453 | $68,672 | $13,150 | $55,522 |
| 2017 | $5,444 | $67,069 | $12,843 | $54,226 |
| 2016 | $5,308 | $64,770 | $12,403 | $52,367 |
| 2015 | $5,167 | $62,489 | $11,966 | $50,523 |
| 2014 | $5,167 | $62,055 | $11,883 | $50,172 |
| 2013 | $5,167 | $62,860 | $12,037 | $50,823 |
Source: Public Records
Map
Nearby Homes
- 9772 Folkers Dr
- 9748 Folkers Dr
- 9736 Folkers Dr
- 9724 Folkers Dr
- 8551 W Lincoln Hwy
- 14 Old Frankfort Way
- 337 Sherlock St
- 481 Pleasant Hill Rd
- 119 Pleasant Hill Ct
- Lot 3 Town Center Dr
- 425 Cottonwood Rd
- 21160 S 93rd Ave
- 117 Linden Dr
- 725 Birchwood Rd
- 10214 Frankfort Main
- 130 Evergreen Dr
- 21203 S 93rd Ave
- 764 Leslie Ln
- 9378 Fox Run Cir Unit 21B
- 267 Center Rd