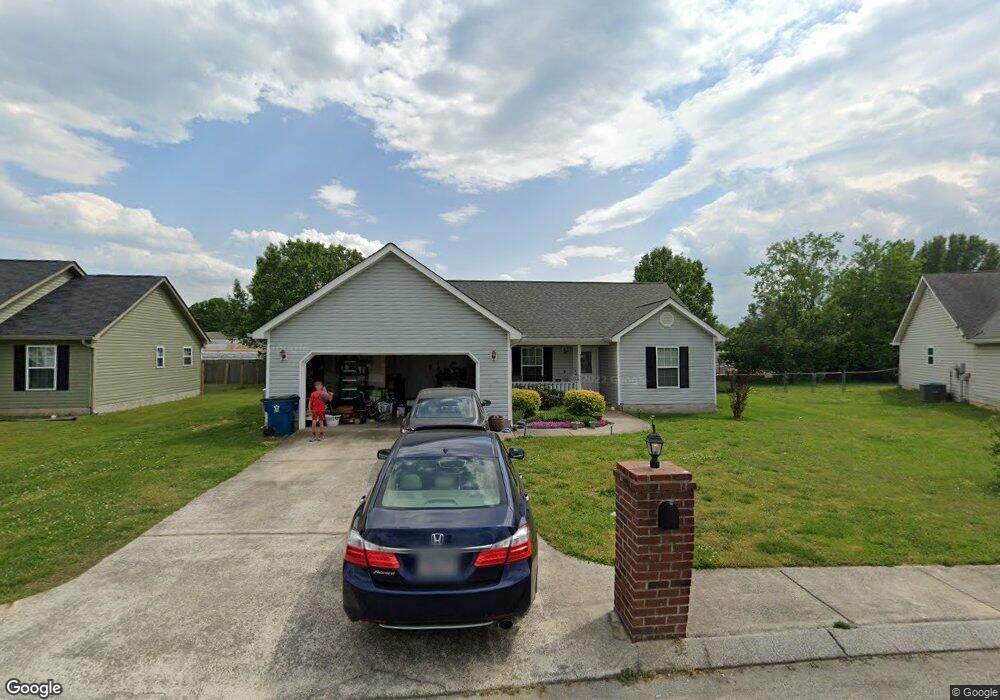
249 Glenn Wade Dr Rossville, GA 30741
Estimated Value: $242,000 - $250,000
3
Beds
2
Baths
1,248
Sq Ft
$197/Sq Ft
Est. Value
About This Home
This home is located at 249 Glenn Wade Dr, Rossville, GA 30741 and is currently estimated at $245,499, approximately $196 per square foot. 249 Glenn Wade Dr is a home located in Walker County with nearby schools including Rossville Elementary School, Rossville Middle School, and Ridgeland High School.
Ownership History
Date
Name
Owned For
Owner Type
Purchase Details
Closed on
Aug 4, 2009
Sold by
Allen Yvonne
Bought by
Aurora Loan Svcs Llc
Current Estimated Value
Purchase Details
Closed on
Aug 4, 2008
Sold by
Not Provided
Bought by
Keith Timothy S and Keith Jennie R
Purchase Details
Closed on
Nov 14, 2005
Sold by
Not Provided
Bought by
Keith Timothy S and Keith Jennie R
Purchase Details
Closed on
Aug 23, 2005
Sold by
Brackett Chad D
Bought by
Allen Yvonne
Home Financials for this Owner
Home Financials are based on the most recent Mortgage that was taken out on this home.
Original Mortgage
$937,600
Interest Rate
5.71%
Mortgage Type
New Conventional
Purchase Details
Closed on
Dec 13, 2004
Sold by
Eaker Lee
Bought by
Brackett Chad D and Brackett Kristy R
Purchase Details
Closed on
Mar 8, 2004
Bought by
Baker & Summers Construction
Create a Home Valuation Report for This Property
The Home Valuation Report is an in-depth analysis detailing your home's value as well as a comparison with similar homes in the area
Home Values in the Area
Average Home Value in this Area
Purchase History
| Date | Buyer | Sale Price | Title Company |
|---|---|---|---|
| Aurora Loan Svcs Llc | $77,803 | -- | |
| Federal Home Loan Mortgage Corporation | $77,803 | -- | |
| Keith Timothy S | -- | -- | |
| Keith Timothy S | -- | -- | |
| Allen Yvonne | $117,200 | -- | |
| Brackett Chad D | $106,000 | -- | |
| Eaker Lee | $98,800 | -- | |
| Anderson Jimmy | $92,000 | -- | |
| Baker & Summers Construction | $257,500 | -- |
Source: Public Records
Mortgage History
| Date | Status | Borrower | Loan Amount |
|---|---|---|---|
| Previous Owner | Allen Yvonne | $937,600 | |
| Previous Owner | Allen Yvonne | $234,400 |
Source: Public Records
Tax History Compared to Growth
Tax History
| Year | Tax Paid | Tax Assessment Tax Assessment Total Assessment is a certain percentage of the fair market value that is determined by local assessors to be the total taxable value of land and additions on the property. | Land | Improvement |
|---|---|---|---|---|
| 2024 | $2,776 | $86,381 | $4,800 | $81,581 |
| 2023 | $2,667 | $82,147 | $4,800 | $77,347 |
| 2022 | $1,830 | $71,496 | $4,800 | $66,696 |
| 2021 | $1,361 | $48,346 | $4,800 | $43,546 |
| 2020 | $1,149 | $39,468 | $4,800 | $34,668 |
| 2019 | $1,150 | $39,468 | $4,800 | $34,668 |
| 2018 | $1,174 | $39,468 | $4,800 | $34,668 |
| 2017 | $1,253 | $39,468 | $4,800 | $34,668 |
| 2016 | $1,033 | $39,468 | $4,800 | $34,668 |
| 2015 | $897 | $32,988 | $4,800 | $28,188 |
| 2014 | $863 | $32,988 | $4,800 | $28,188 |
| 2013 | -- | $32,988 | $4,800 | $28,188 |
Source: Public Records
Map
Nearby Homes
- 527 W Gordon Ave
- 509 W Gordon Ave
- 816 Indian Ave
- 200 W Oak St
- 1014 Lee Ave
- 916 Logan Ave
- 53 Charlsie Trail Unit 12
- 1410 E 50th St
- 1403 E 49th St
- 1405 E 49th St
- 806 Mcfarland Ave
- 1014 Wilson Rd
- 115 Beech St
- 635 N Sherry Dr
- 126 S Liner St
- 105 Elm St
- 1515 E 50th St
- 1604 E 46th Street Place
- 1614 E 47th St
- 601 James St
- 239 Glenn Wade Dr
- 238 Glenn Wade Dr
- 276 Glenn Wade Dr
- 267 Glenn Wade Dr
- 244 Glenn Wade Dr
- 279 Glenn Wade Dr
- 296 Glenn Wade Dr
- 234 Glenn Wade Dr
- 285 Glenn Wade Dr
- 213 Glenn Wade Dr
- 616 Glenn Wade Dr
- 287 Glenn Wade Dr
- 302 Glenn Wade Dr
- 163 Frank Fabris Ln
- 159 Frank Fabris Ln
- 0 Glenn Wade Dr Unit 1053682
- 0 Glenn Wade Dr Unit 1058341
- 0 Glenn Wade Dr Unit 1080577
- 0 Glenn Wade Dr Unit 7615582
- 0 Glenn Wade Dr