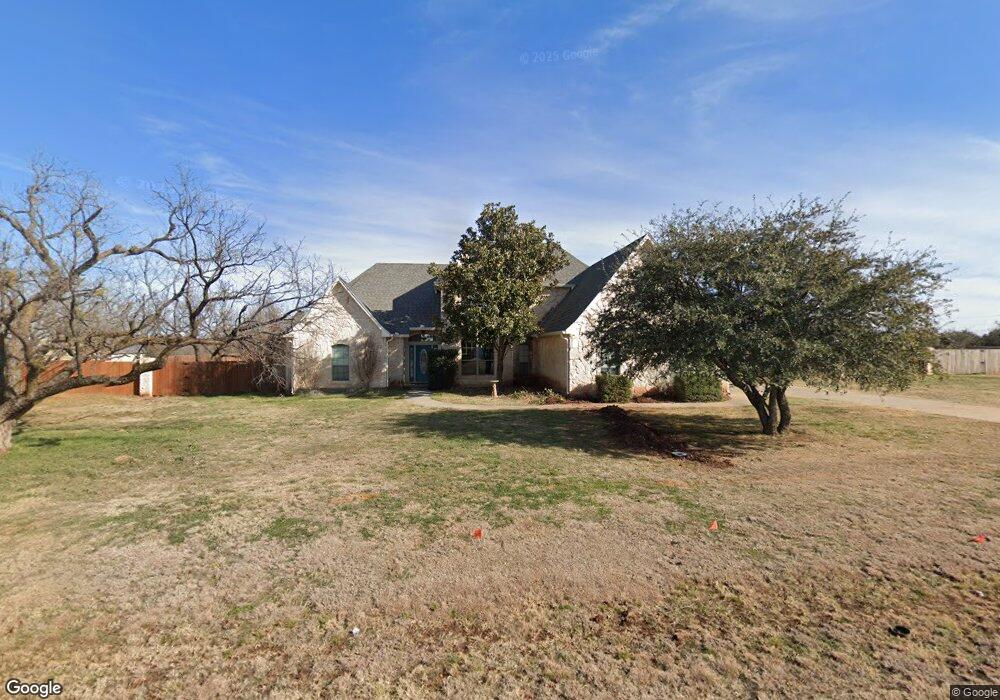
249 Idle Creek Trail Abilene, TX 79602
Estimated Value: $553,545 - $671,000
4
Beds
3
Baths
3,380
Sq Ft
$183/Sq Ft
Est. Value
About This Home
This home is located at 249 Idle Creek Trail, Abilene, TX 79602 and is currently estimated at $619,386, approximately $183 per square foot. 249 Idle Creek Trail is a home located in Taylor County with nearby schools including Wylie West Early Childhood Center, Wylie West Intermediate School, and Wylie West Elementary School.
Ownership History
Date
Name
Owned For
Owner Type
Purchase Details
Closed on
Oct 12, 2018
Sold by
Brown Cecil W and Brown Iia
Bought by
Jordan Jeffry Alan and Reyes Jessica Maria
Current Estimated Value
Home Financials for this Owner
Home Financials are based on the most recent Mortgage that was taken out on this home.
Original Mortgage
$361,000
Outstanding Balance
$314,813
Interest Rate
4.5%
Mortgage Type
New Conventional
Estimated Equity
$304,573
Purchase Details
Closed on
May 30, 2017
Sold by
Presley Edward R and Presley Lisa Jo
Bought by
Brown Cecil W and Brown Ila
Purchase Details
Closed on
May 25, 2006
Sold by
White Roddy S and White Dana M
Bought by
Presley Edward R
Home Financials for this Owner
Home Financials are based on the most recent Mortgage that was taken out on this home.
Original Mortgage
$61,560
Interest Rate
6.56%
Mortgage Type
Stand Alone Second
Create a Home Valuation Report for This Property
The Home Valuation Report is an in-depth analysis detailing your home's value as well as a comparison with similar homes in the area
Home Values in the Area
Average Home Value in this Area
Purchase History
| Date | Buyer | Sale Price | Title Company |
|---|---|---|---|
| Jordan Jeffry Alan | -- | None Available | |
| Brown Cecil W | -- | None Available | |
| Brown Cecil W | -- | None Available | |
| Presley Edward R | -- | None Available |
Source: Public Records
Mortgage History
| Date | Status | Borrower | Loan Amount |
|---|---|---|---|
| Open | Jordan Jeffry Alan | $361,000 | |
| Previous Owner | Presley Edward R | $61,560 | |
| Previous Owner | Presley Edward R | $246,240 |
Source: Public Records
Tax History Compared to Growth
Tax History
| Year | Tax Paid | Tax Assessment Tax Assessment Total Assessment is a certain percentage of the fair market value that is determined by local assessors to be the total taxable value of land and additions on the property. | Land | Improvement |
|---|---|---|---|---|
| 2025 | $7,585 | $506,780 | $36,524 | $470,256 |
| 2023 | $7,585 | $510,109 | $0 | $0 |
| 2022 | $7,408 | $463,735 | $0 | $0 |
| 2021 | $7,539 | $421,577 | $36,524 | $385,053 |
| 2020 | $7,100 | $387,786 | $36,524 | $351,262 |
| 2019 | $7,048 | $368,852 | $36,524 | $332,328 |
| 2018 | $5,414 | $313,311 | $36,524 | $276,787 |
| 2017 | $5,727 | $343,969 | $36,524 | $307,445 |
| 2016 | $6,146 | $369,113 | $36,524 | $332,589 |
| 2015 | $5,464 | $372,443 | $36,524 | $335,919 |
| 2014 | $5,464 | $361,943 | $0 | $0 |
Source: Public Records
Map
Nearby Homes
- 217 Idle Creek Trail
- 302 Southwind Cir
- 432 Clark Rd
- 987 Bacacita Farms Rd
- 966 Bacacita Farms Rd
- 221 Codybug Rd
- 1089 Larned Ln
- 1165 Key Ln
- 235 Hog Eye Rd
- 2057 Deer Trail
- 266 Handsome Jack Rd
- TBD-1 Acre Lot Potos Wolfe Rd
- 210 Foothill Rd
- 361 Foothill Rd
- 310 Foothill Rd
- 125 Dorado Ct
- 117 Vaquero Ct
- 341 Long Ranger Rd
- 234 Tweetie Pie Ln
- Lot 2 Palomino
- 109 Papasan Ln
- 110 Papasan Ln
- 301 Idle Creek Trail
- 110 Papasan Ln
- 233 Idle Creek Trail
- 250 Idle Creek Trail
- 218 Idle Creek Trail
- 317 Idle Creek Trail
- 318 Idle Creek Trail
- 201 Idle Creek Trail
- 249 Southwind Cir
- 166 Clark Rd
- 301 Southwind Cir
- 233 Southwind Cir
- 202 Idle Creek Trail
- 226 Southwind Cir
- 218 Southwind Cir
- 250 Southwind Cir
- 217 Southwind Cir
- 201 Southwind Cir