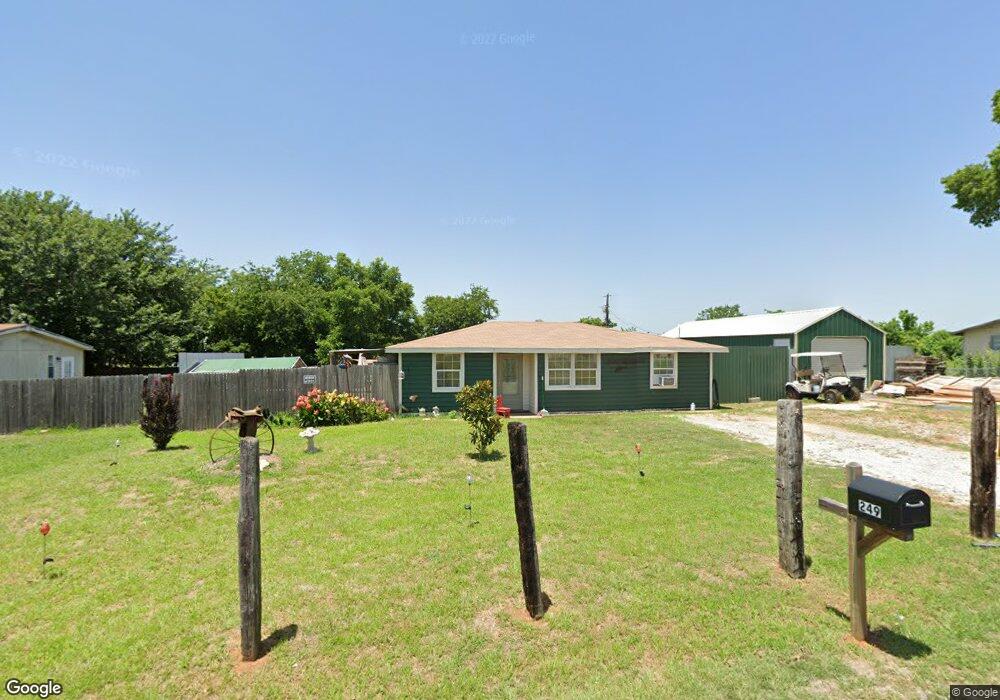
249 Kyker Ln Pottsboro, TX 75076
Estimated Value: $212,000 - $215,371
4
Beds
1
Bath
1,020
Sq Ft
$209/Sq Ft
Est. Value
About This Home
This home is located at 249 Kyker Ln, Pottsboro, TX 75076 and is currently estimated at $213,686, approximately $209 per square foot. 249 Kyker Ln is a home located in Grayson County with nearby schools including Pottsboro Elementary School, Pottsboro Middle School, and Pottsboro High School.
Ownership History
Date
Name
Owned For
Owner Type
Purchase Details
Closed on
Jun 20, 2025
Sold by
Snyder Christina Robin Record and Snyder Christina Robin
Bought by
Snyder Daniel Lee
Current Estimated Value
Purchase Details
Closed on
Oct 14, 2014
Sold by
Record Eric M
Bought by
Snyder Daniel and Snyder Christina R
Purchase Details
Closed on
Oct 1, 2013
Sold by
Secretary Of Hud
Bought by
Record Eric M
Home Financials for this Owner
Home Financials are based on the most recent Mortgage that was taken out on this home.
Original Mortgage
$21,300
Interest Rate
4.62%
Mortgage Type
FHA
Purchase Details
Closed on
Dec 20, 2012
Sold by
U S Bank N A
Bought by
The Secretary Of Hud
Purchase Details
Closed on
Sep 29, 1999
Sold by
Hunter Beverly J
Bought by
Us Bank National Assn
Create a Home Valuation Report for This Property
The Home Valuation Report is an in-depth analysis detailing your home's value as well as a comparison with similar homes in the area
Home Values in the Area
Average Home Value in this Area
Purchase History
| Date | Buyer | Sale Price | Title Company |
|---|---|---|---|
| Snyder Daniel Lee | -- | None Listed On Document | |
| Snyder Daniel | -- | None Available | |
| Record Eric M | -- | None Available | |
| The Secretary Of Hud | -- | None Available | |
| Us Bank National Assn | $53,093 | None Available |
Source: Public Records
Mortgage History
| Date | Status | Borrower | Loan Amount |
|---|---|---|---|
| Previous Owner | Record Eric M | $21,300 |
Source: Public Records
Tax History Compared to Growth
Tax History
| Year | Tax Paid | Tax Assessment Tax Assessment Total Assessment is a certain percentage of the fair market value that is determined by local assessors to be the total taxable value of land and additions on the property. | Land | Improvement |
|---|---|---|---|---|
| 2025 | $1,261 | $168,312 | $38,298 | $130,014 |
| 2024 | $2,296 | $165,733 | $33,579 | $132,154 |
| 2023 | $1,080 | $153,435 | $0 | $0 |
| 2022 | $1,964 | $124,779 | $23,400 | $101,379 |
| 2021 | $1,955 | $120,228 | $19,500 | $100,728 |
| 2020 | $1,969 | $116,611 | $9,750 | $106,861 |
| 2019 | $1,783 | $100,801 | $9,750 | $91,051 |
| 2018 | $1,759 | $98,189 | $9,750 | $88,439 |
| 2017 | $759 | $87,439 | $6,435 | $81,004 |
| 2016 | $1,146 | $63,123 | $5,460 | $57,663 |
| 2015 | $474 | $25,676 | $5,460 | $20,216 |
| 2014 | $461 | $24,729 | $5,460 | $19,269 |
Source: Public Records
Map
Nearby Homes
- 0000 Reeves Rd
- TBD Hagerman Rd
- 104 Chisolm Trail
- 109 Chisolm Trail
- Lot 48 Spout Springs Rd
- 000 Loving Trail
- 121 Shawnee Trail
- 117 Chisolm Trail
- 124 Chisolm Trail
- 129 Chisolm Trail
- 100 Chisolm Trail
- 125 Shawnee Trail
- 144 Shawnee Trail
- 283 Cooks Corner Rd
- 1050 Cooks Corner Rd
- 133 S Meadowbrook Dr
- 297 Cemetery Rd
- 3.269 Ac Sh 289
- 20 AC Preston Bend Rd
- 49 AC Preston Bend Rd