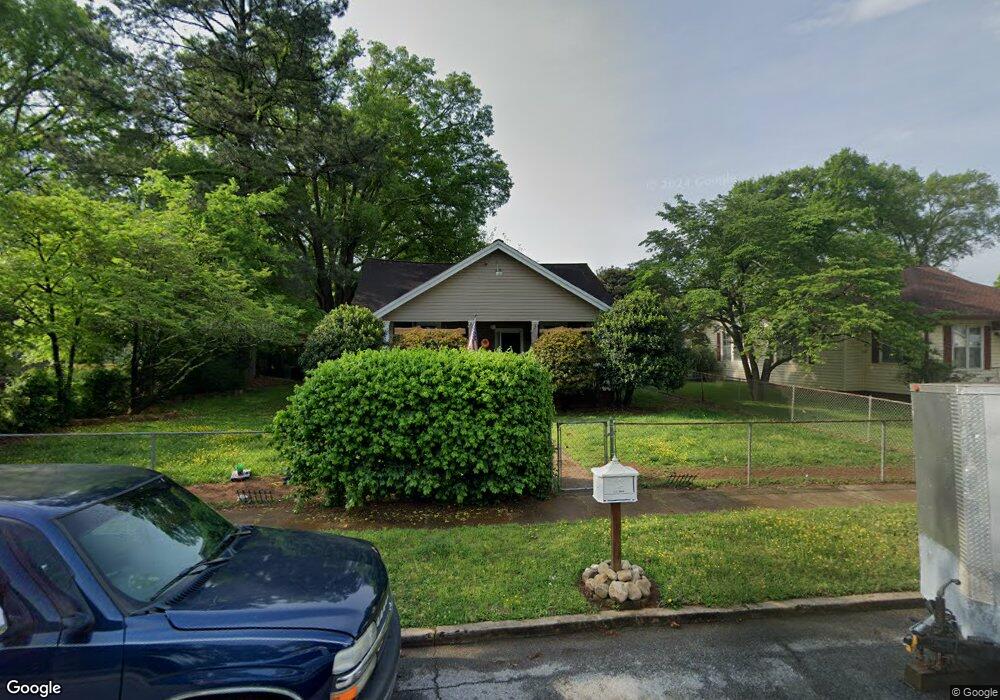
249 Litchfield St Rockmart, GA 30153
Estimated Value: $140,000 - $222,000
3
Beds
1
Bath
1,136
Sq Ft
$150/Sq Ft
Est. Value
About This Home
This home is located at 249 Litchfield St, Rockmart, GA 30153 and is currently estimated at $170,909, approximately $150 per square foot. 249 Litchfield St is a home located in Polk County.
Ownership History
Date
Name
Owned For
Owner Type
Purchase Details
Closed on
Feb 3, 2003
Sold by
Brogdon Jason Heath
Bought by
Brogdon Carrie
Current Estimated Value
Purchase Details
Closed on
Nov 8, 1999
Sold by
Reynolds Betty J Executix Of Earnest L W
Bought by
Brogdon Jason H and Brogdon Carrie L
Purchase Details
Closed on
Apr 6, 1999
Sold by
Gammon Wayne W
Bought by
The Estate Of Earnest L Waits
Purchase Details
Closed on
Mar 12, 1992
Sold by
Bishop Michael D
Bought by
Waits Louise D
Purchase Details
Closed on
Jan 19, 1990
Sold by
Ridley Randy and Ridley Cindy
Bought by
Bishop Michael D
Purchase Details
Closed on
Apr 12, 1989
Sold by
Barber Elmer G
Bought by
Ridley Randy L
Purchase Details
Closed on
Apr 21, 1975
Sold by
Bearden Farris C Mrs
Bought by
Barber Elmer and Barber Audie
Purchase Details
Closed on
Sep 30, 1972
Sold by
Bearden Farris C
Bought by
Bearden Farris Cmrs*
Purchase Details
Closed on
Nov 28, 1952
Bought by
Bearden Farris C
Create a Home Valuation Report for This Property
The Home Valuation Report is an in-depth analysis detailing your home's value as well as a comparison with similar homes in the area
Home Values in the Area
Average Home Value in this Area
Purchase History
| Date | Buyer | Sale Price | Title Company |
|---|---|---|---|
| Brogdon Carrie | -- | -- | |
| Brogdon Jason H | $46,900 | -- | |
| The Estate Of Earnest L Waits | -- | -- | |
| Waits Louise D | $32,000 | -- | |
| Bishop Michael D | $29,000 | -- | |
| Ridley Randy L | $29,500 | -- | |
| Barber Elmer | -- | -- | |
| Bearden Farris Cmrs* | -- | -- | |
| Bearden Farris C | -- | -- |
Source: Public Records
Tax History Compared to Growth
Tax History
| Year | Tax Paid | Tax Assessment Tax Assessment Total Assessment is a certain percentage of the fair market value that is determined by local assessors to be the total taxable value of land and additions on the property. | Land | Improvement |
|---|---|---|---|---|
| 2024 | $1,163 | $42,290 | $8,000 | $34,290 |
| 2023 | $700 | $23,328 | $1,600 | $21,728 |
| 2022 | $431 | $20,182 | $1,600 | $18,582 |
| 2021 | $437 | $20,182 | $1,600 | $18,582 |
| 2020 | $438 | $20,182 | $1,600 | $18,582 |
| 2019 | $384 | $16,291 | $871 | $15,420 |
| 2018 | $380 | $15,776 | $871 | $14,905 |
| 2017 | $375 | $15,776 | $871 | $14,905 |
| 2016 | $375 | $15,776 | $871 | $14,905 |
| 2015 | $383 | $16,022 | $871 | $15,151 |
| 2014 | $317 | $13,533 | $1,149 | $12,384 |
Source: Public Records
Map
Nearby Homes
- 247 Litchfield St
- 232 Litchfield St
- 451 Clearwater St
- 11 Lot
- 200 Litchfield St
- 530 Hogue Ave
- 7667 Georgia 101
- 123 Nicole Cir
- 1029 Fairview Rd
- 1012 Fairview Rd
- 0 Peachtree Rd Unit 19311295
- 0 Nathan Dean Bypass Unit 10434274
- 825 Wilson St
- 540 N Marble St
- 605 Gates Dr
- 119 Pearl St
- 571 N Marble St
- 222 Whitley Crossing
- 582 Barnwood Dr
- 251 Litchfield St
- 245 Litchfield St
- 253 Litchfield St
- 250 Litchfield St
- 680 Goodyear Ave
- 252 Litchfield St
- 255 Litchfield St
- 678 Goodyear Ave
- 248 Litchfield St
- 682 Goodyear Ave
- 254 Litchfield St
- 243 Litchfield St
- 676 Goodyear Ave
- 256 Litchfield St
- 684 Goodyear Ave
- 246 Litchfield St
- 258 Litchfield St
- 674 Goodyear Ave
- 686 Goodyear Ave
- 244 Litchfield St