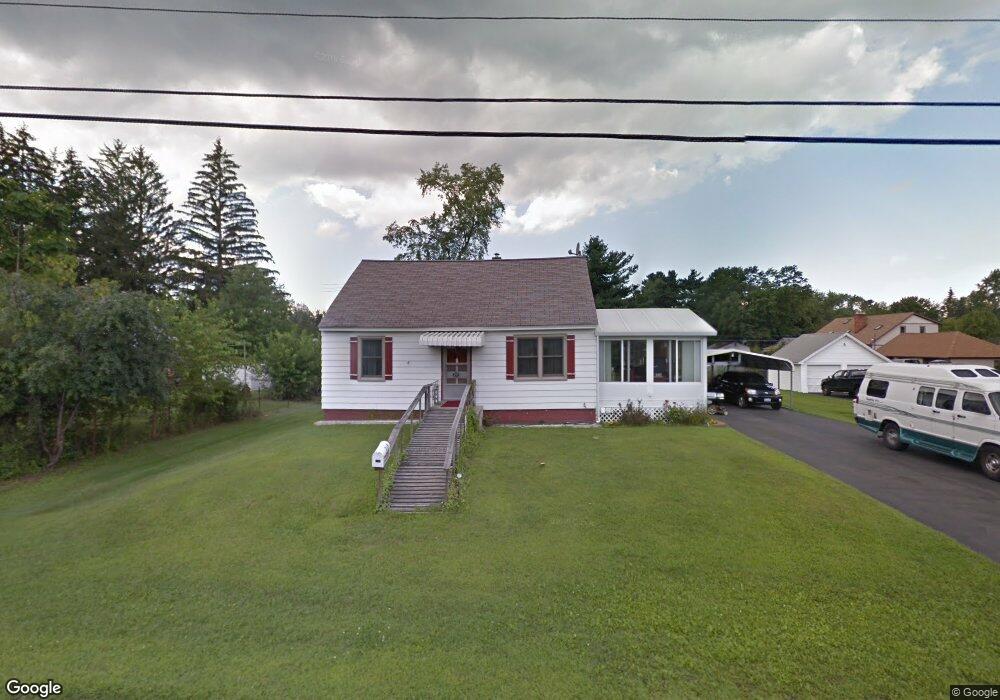
249 Manchester Rd Schenectady, NY 12304
Estimated Value: $197,654 - $243,000
2
Beds
1
Bath
868
Sq Ft
$253/Sq Ft
Est. Value
About This Home
This home is located at 249 Manchester Rd, Schenectady, NY 12304 and is currently estimated at $219,664, approximately $253 per square foot. 249 Manchester Rd is a home located in Schenectady County with nearby schools including Woodlawn School, Central Park Middle School, and Schenectady High School.
Ownership History
Date
Name
Owned For
Owner Type
Purchase Details
Closed on
Oct 6, 2023
Sold by
Gordon Lawrence M
Bought by
Live Better Realty Llc
Current Estimated Value
Purchase Details
Closed on
Mar 21, 2022
Sold by
Wager John B
Bought by
Wager John B and Wager Carolyn W
Purchase Details
Closed on
Nov 17, 2020
Sold by
Wager Carolyn
Bought by
Reverse Mortgage Solutions Inc
Purchase Details
Closed on
Sep 18, 2003
Sold by
Corbett Marjorie
Bought by
Wager John B
Purchase Details
Closed on
Aug 30, 2001
Sold by
Nayman Nayman T and Nayman H
Bought by
Corbett Marjorie
Create a Home Valuation Report for This Property
The Home Valuation Report is an in-depth analysis detailing your home's value as well as a comparison with similar homes in the area
Purchase History
| Date | Buyer | Sale Price | Title Company |
|---|---|---|---|
| Live Better Realty Llc | $120,000 | None Listed On Document | |
| Wager John B | -- | None Listed On Document | |
| Reverse Mortgage Solutions Inc | -- | -- | |
| Wager John B | $67,200 | Albie Ferrucci | |
| Corbett Marjorie | -- | -- |
Source: Public Records
Tax History
| Year | Tax Paid | Tax Assessment Tax Assessment Total Assessment is a certain percentage of the fair market value that is determined by local assessors to be the total taxable value of land and additions on the property. | Land | Improvement |
|---|---|---|---|---|
| 2024 | $5,534 | $109,600 | $16,400 | $93,200 |
| 2023 | $54 | $109,600 | $16,400 | $93,200 |
| 2022 | $5,283 | $109,600 | $16,400 | $93,200 |
| 2021 | $5,283 | $109,600 | $16,400 | $93,200 |
| 2020 | $4,274 | $109,600 | $16,400 | $93,200 |
| 2019 | $2,655 | $109,600 | $16,400 | $93,200 |
| 2018 | $3,537 | $109,600 | $16,400 | $93,200 |
| 2017 | $3,256 | $109,600 | $16,400 | $93,200 |
| 2016 | $3,747 | $109,600 | $16,400 | $93,200 |
| 2015 | -- | $109,600 | $16,400 | $93,200 |
| 2014 | -- | $109,600 | $16,400 | $93,200 |
Source: Public Records
Map
Nearby Homes
- 247 Chiswell Rd
- 318 Chiswell Rd
- 3307 Woodlawn Ave
- 304 Dearborn Ave
- 150 Gifford Rd
- 126 Manchester Rd
- 435 Gifford Rd
- 475 Chadwick Rd
- 37 Chiswell St
- 476 Bradford Rd
- 15 Manchester Rd
- 3323 McDonald Ave
- 320 Gasner Ave
- 3418 Albany St
- 8 Chester St
- 191 Fillmore Ave
- 1044 Climax Ave
- 517 Kings Rd
- L.18 Climax Ave
- 45 Lorraine Ave
- 237 Manchester Rd
- 231 Manchester Rd
- 252 Chiswell Rd
- 238 Manchester Rd
- 252 Manchester Rd
- 0 Manchester Rd
- 258 Chiswell Rd
- 230 Chiswell Rd
- 254 Manchester Rd
- 227 Manchester Rd
- 3275 Maryvale Dr
- 305 Manchester Rd
- 230 Manchester Rd
- 309 Manchester Rd
- 249 Gifford Rd
- 302 Chiswell Rd
- 219 Manchester Rd
- 218 Chiswell Rd
- 306 Manchester Rd
- 3297 Maryvale Dr
Your Personal Tour Guide
Ask me questions while you tour the home.