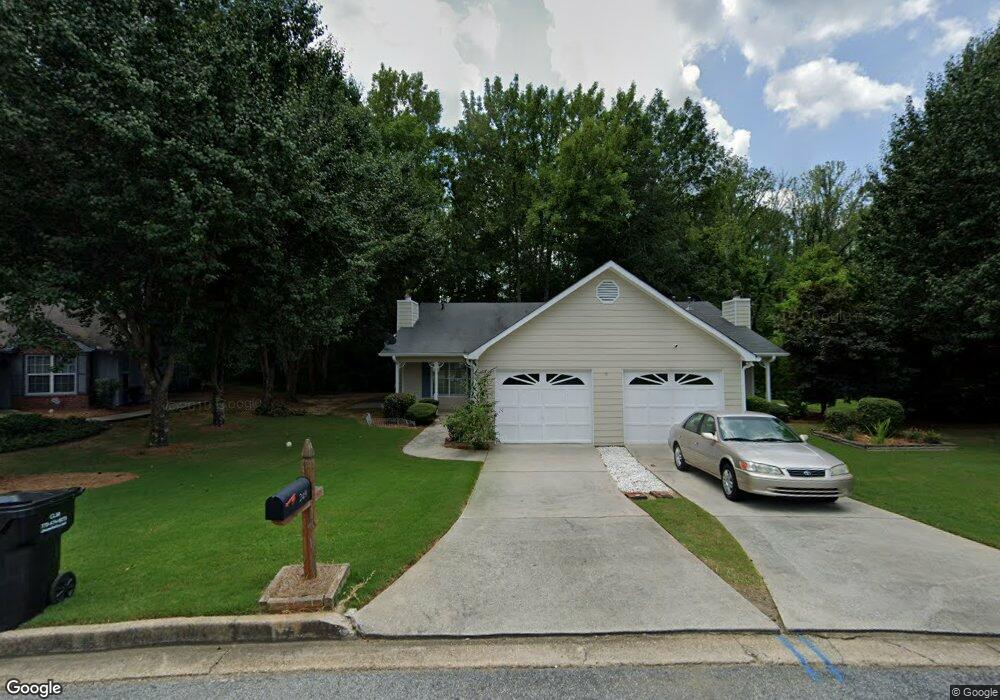
249 Monmouth Dr Fayetteville, GA 30214
Estimated Value: $224,000 - $255,000
2
Beds
2
Baths
1,260
Sq Ft
$192/Sq Ft
Est. Value
About This Home
This home is located at 249 Monmouth Dr, Fayetteville, GA 30214 and is currently estimated at $242,282, approximately $192 per square foot. 249 Monmouth Dr is a home located in Fayette County with nearby schools including Spring Hill Elementary School, Bennett's Mill Middle School, and Fayette County High School.
Ownership History
Date
Name
Owned For
Owner Type
Purchase Details
Closed on
Nov 6, 2023
Sold by
Murray Marva Anita
Bought by
Marva Anita Murray Revocable Living Trust and Murray
Current Estimated Value
Purchase Details
Closed on
Apr 5, 2017
Sold by
Delta Cmnty Cu
Bought by
Murray Marva
Home Financials for this Owner
Home Financials are based on the most recent Mortgage that was taken out on this home.
Original Mortgage
$85,950
Interest Rate
4.21%
Mortgage Type
New Conventional
Purchase Details
Closed on
Dec 6, 2016
Sold by
Durden Juanita C
Bought by
Delta Community Cr Un
Purchase Details
Closed on
Jun 3, 1998
Sold by
Eades Barbara S
Bought by
Durden Wm C and Durden Juanita
Home Financials for this Owner
Home Financials are based on the most recent Mortgage that was taken out on this home.
Original Mortgage
$33,000
Interest Rate
7.04%
Mortgage Type
New Conventional
Create a Home Valuation Report for This Property
The Home Valuation Report is an in-depth analysis detailing your home's value as well as a comparison with similar homes in the area
Home Values in the Area
Average Home Value in this Area
Purchase History
| Date | Buyer | Sale Price | Title Company |
|---|---|---|---|
| Marva Anita Murray Revocable Living Trust | -- | None Listed On Document | |
| Murray Marva | $95,500 | -- | |
| Delta Community Cr Un | -- | -- | |
| Durden Wm C | $80,700 | -- |
Source: Public Records
Mortgage History
| Date | Status | Borrower | Loan Amount |
|---|---|---|---|
| Previous Owner | Murray Marva | $85,950 | |
| Previous Owner | Durden Wm C | $33,000 |
Source: Public Records
Tax History Compared to Growth
Tax History
| Year | Tax Paid | Tax Assessment Tax Assessment Total Assessment is a certain percentage of the fair market value that is determined by local assessors to be the total taxable value of land and additions on the property. | Land | Improvement |
|---|---|---|---|---|
| 2024 | $894 | $90,604 | $14,000 | $76,604 |
| 2023 | $696 | $86,000 | $14,000 | $72,000 |
| 2022 | $682 | $67,920 | $14,000 | $53,920 |
| 2021 | $552 | $55,600 | $14,000 | $41,600 |
| 2020 | $572 | $56,320 | $10,000 | $46,320 |
| 2019 | $485 | $47,640 | $10,000 | $37,640 |
| 2018 | $384 | $38,200 | $7,120 | $31,080 |
| 2017 | $1,130 | $37,800 | $8,000 | $29,800 |
| 2016 | $280 | $32,560 | $8,000 | $24,560 |
| 2015 | $315 | $35,480 | $9,600 | $25,880 |
| 2014 | $296 | $32,280 | $9,600 | $22,680 |
| 2013 | -- | $32,280 | $0 | $0 |
Source: Public Records
Map
Nearby Homes
- 405 415 Chase Dr
- 105 Deep Forest Ln
- 1305 & 1307 Highway 54
- 120 Deep Forest Ln Unit 1
- 105 Rehobeth Way
- 115 Climbing Ivy Cir
- 125 Climbing Ivy Cir
- 210 Colonial Ct
- 550 Thatch Terrace
- 325 Enchanted Ct
- 220 Rehobeth Way
- 0 Hwy 54 West of Yorktown Dr Unit 10463188
- Thornewood Plan at Village Towns
- 175 Honey Ln
- 265 Rehobeth Way
- 275 Rehobeth Way
- 165 Honey Ln
- 155 Butterton Ct
- 210 Marilyn Dr E
- 160 Winona Dr
- 245 Monmouth Dr
- 255 Monmouth Dr Unit 125
- 255 Monmouth Dr Unit 97A
- 255 Monmouth Dr
- 259 Monmouth Dr
- 265 Monmouth Dr
- 225 Monmouth Dr
- 230 Monmouth Dr
- 230 Monmouth Dr Unit 99
- 275 Monmouth Dr
- 215 Monmouth Dr
- 250 Monmouth Dr
- 285 Monmouth Dr
- 3617 Monmouth Dr
- 0 Monmouth Dr Unit 3233020
- 0 Monmouth Dr Unit 7010933
- 0 Monmouth Dr Unit 7009815
- 0 Monmouth Dr Unit 3250736
- 0 Monmouth Dr Unit 8382967
- 0 Monmouth Dr Unit 8142437