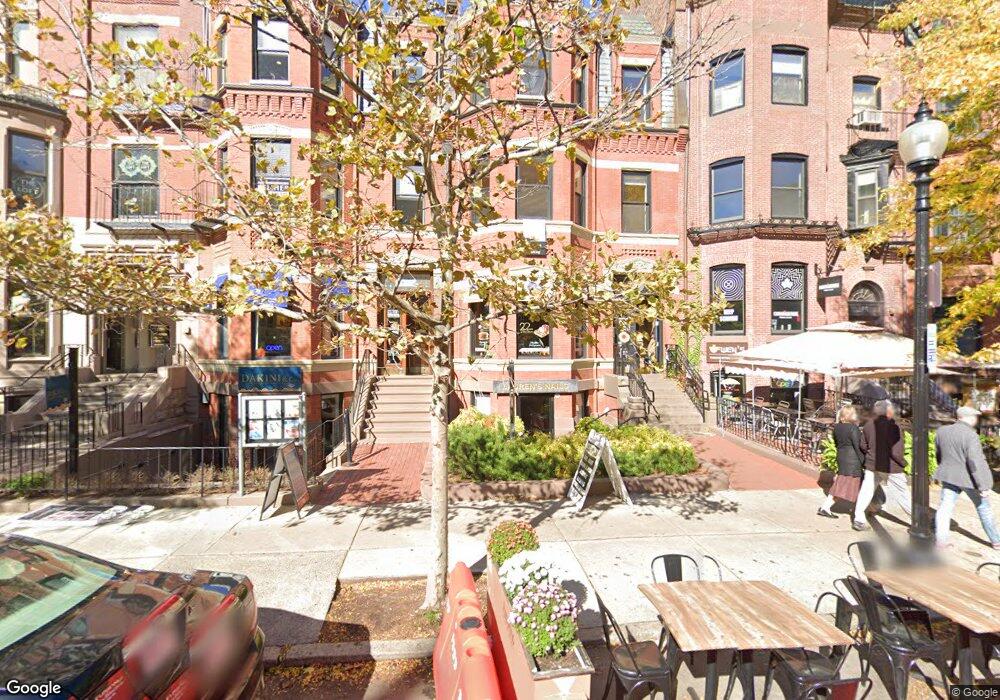
249 Newbury St Unit C-2 Boston, MA 02116
Back Bay NeighborhoodEstimated Value: $2,873,061
--
Bed
--
Bath
930
Sq Ft
$3,089/Sq Ft
Est. Value
About This Home
This home is located at 249 Newbury St Unit C-2, Boston, MA 02116 and is currently estimated at $2,873,061, approximately $3,089 per square foot. 249 Newbury St Unit C-2 is a home located in Suffolk County with nearby schools including Edward M. Kennedy Academy for Health Careers, Kingsley Montessori School, and Park Street School.
Ownership History
Date
Name
Owned For
Owner Type
Purchase Details
Closed on
Dec 30, 2013
Sold by
249 Newbury Inv Llc
Bought by
Linear Retail Boston 1
Current Estimated Value
Purchase Details
Closed on
Jun 2, 2011
Sold by
Aps Realty Llc
Bought by
249 Newbury Invest Llc
Purchase Details
Closed on
Jan 14, 2008
Sold by
Shane Frederick Inc
Bought by
Aps Realty Llc
Home Financials for this Owner
Home Financials are based on the most recent Mortgage that was taken out on this home.
Original Mortgage
$567,500
Interest Rate
6.21%
Mortgage Type
Commercial
Create a Home Valuation Report for This Property
The Home Valuation Report is an in-depth analysis detailing your home's value as well as a comparison with similar homes in the area
Home Values in the Area
Average Home Value in this Area
Purchase History
| Date | Buyer | Sale Price | Title Company |
|---|---|---|---|
| Linear Retail Boston 1 | $1,370,000 | -- | |
| 249 Newbury Invest Llc | $1,000,000 | -- | |
| Aps Realty Llc | $1,135,000 | -- |
Source: Public Records
Mortgage History
| Date | Status | Borrower | Loan Amount |
|---|---|---|---|
| Previous Owner | Aps Realty Llc | $567,500 |
Source: Public Records
Tax History Compared to Growth
Tax History
| Year | Tax Paid | Tax Assessment Tax Assessment Total Assessment is a certain percentage of the fair market value that is determined by local assessors to be the total taxable value of land and additions on the property. | Land | Improvement |
|---|---|---|---|---|
| 2025 | $27,606 | $1,063,400 | $0 | $1,063,400 |
| 2024 | $28,318 | $1,120,600 | $0 | $1,120,600 |
| 2023 | $28,357 | $1,149,000 | $0 | $1,149,000 |
| 2022 | $28,342 | $1,134,600 | $0 | $1,134,600 |
| 2021 | $28,561 | $1,163,400 | $0 | $1,163,400 |
| 2020 | $28,992 | $1,163,400 | $0 | $1,163,400 |
| 2019 | $39,250 | $1,570,000 | $0 | $1,570,000 |
| 2018 | $38,632 | $1,533,000 | $0 | $1,533,000 |
| 2017 | $36,888 | $1,454,000 | $0 | $1,454,000 |
| 2016 | $35,121 | $1,310,000 | $0 | $1,310,000 |
| 2015 | $34,730 | $1,176,500 | $0 | $1,176,500 |
| 2014 | $26,721 | $857,000 | $0 | $857,000 |
Source: Public Records
Map
Nearby Homes
- 250 Commonwealth Ave Unit 7
- 250 Commonwealth Ave Unit 11
- 250 Commonwealth Ave Unit 6
- 260-262 Commonwealth Ave Unit 1A
- 260-262 Commonwealth Ave Unit 1B
- 245 Newbury St
- 239 Commonwealth Ave Unit 52
- 228 Commonwealth Ave Unit 9
- 273 Commonwealth Ave Unit 9
- 298 Marlborough St Unit 1
- 776 Boylston St Unit E9A
- 776 Boylston St Unit E9C
- 776 Boylston St Unit W11B
- 778 Boylston St Unit 7E
- 778 Boylston St Unit W6D
- 259 Marlborough St Unit 5
- 261 Marlborough St Unit 1
- 261 Marlborough St Unit 12
- 285 Commonwealth Ave
- 357-359 Beacon St Unit 4
- 249 Newbury St Unit P3
- 249 Newbury St Unit R2
- 249 Newbury St Unit R1
- 249 Newbury St Unit 254 newbury street
- 249 Newbury St Unit 4
- 249 Newbury St Unit 10
- 249 Newbury St Unit 3
- 249 Newbury St Unit 1
- 249 Newbury St Unit 5
- 249 Newbury St Unit C
- 249 Newbury St Unit 2
- 249 Newbury St Unit J1
- 249 Newbury St Unit 2A
- 247 Newbury St Unit 3F
- 247 Newbury St Unit 2B
- 247 Newbury St Unit 2R
- 247 Newbury St Unit 3
- 247 Newbury St Unit PH
- 247 Newbury St
- 247 Newbury St Unit 2F