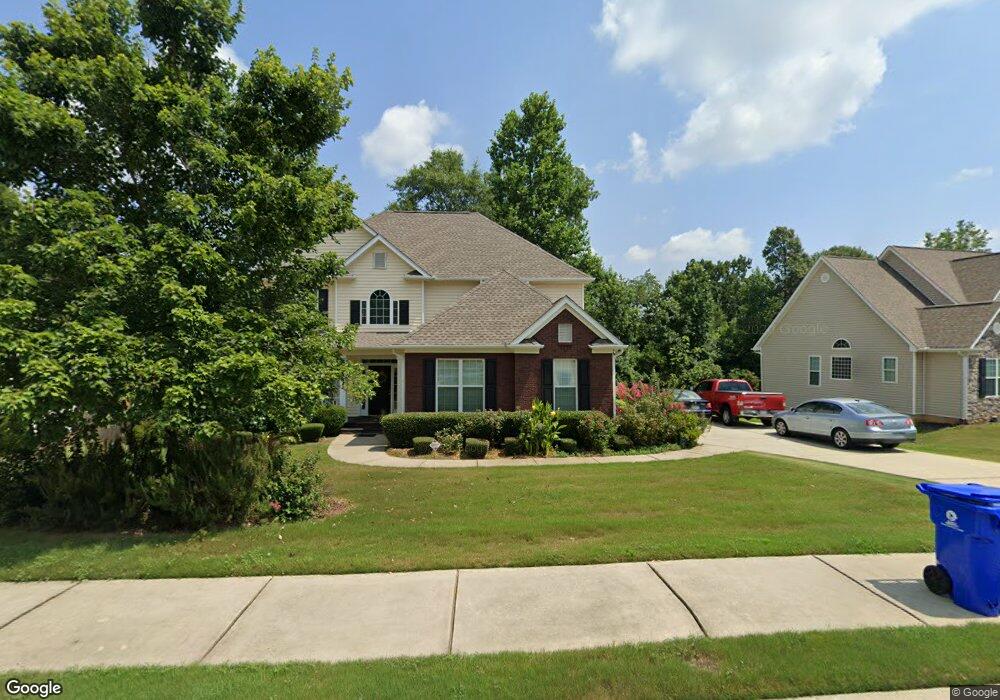
249 Otter Cir Fayetteville, GA 30215
Estimated Value: $488,000 - $555,250
4
Beds
4
Baths
2,450
Sq Ft
$213/Sq Ft
Est. Value
About This Home
This home is located at 249 Otter Cir, Fayetteville, GA 30215 and is currently estimated at $521,063, approximately $212 per square foot. 249 Otter Cir is a home located in Fayette County with nearby schools including Cleveland Elementary School, Bennett's Mill Middle School, and Fayette County High School.
Ownership History
Date
Name
Owned For
Owner Type
Purchase Details
Closed on
Nov 17, 2015
Sold by
Hanson Peter L
Bought by
Holder Emil and Holder Michelle
Current Estimated Value
Home Financials for this Owner
Home Financials are based on the most recent Mortgage that was taken out on this home.
Original Mortgage
$258,629
Outstanding Balance
$203,700
Interest Rate
3.83%
Mortgage Type
FHA
Estimated Equity
$317,363
Purchase Details
Closed on
Apr 11, 2005
Sold by
Hanson Peter L
Bought by
Hanson Peter L and Hanson Frances
Home Financials for this Owner
Home Financials are based on the most recent Mortgage that was taken out on this home.
Original Mortgage
$222,320
Interest Rate
4.5%
Mortgage Type
New Conventional
Purchase Details
Closed on
Jan 27, 2005
Sold by
J & J Quality Homes Inc
Bought by
Riley Jackie R and Riley Yvetta
Home Financials for this Owner
Home Financials are based on the most recent Mortgage that was taken out on this home.
Original Mortgage
$230,400
Interest Rate
5.25%
Mortgage Type
New Conventional
Create a Home Valuation Report for This Property
The Home Valuation Report is an in-depth analysis detailing your home's value as well as a comparison with similar homes in the area
Home Values in the Area
Average Home Value in this Area
Purchase History
| Date | Buyer | Sale Price | Title Company |
|---|---|---|---|
| Holder Emil | $263,400 | -- | |
| Hanson Peter L | -- | -- | |
| Hanson Peter L | $277,900 | -- | |
| Riley Jackie R | $288,000 | -- |
Source: Public Records
Mortgage History
| Date | Status | Borrower | Loan Amount |
|---|---|---|---|
| Open | Holder Emil | $258,629 | |
| Previous Owner | Hanson Peter L | $222,320 | |
| Previous Owner | Riley Jackie R | $230,400 |
Source: Public Records
Tax History Compared to Growth
Tax History
| Year | Tax Paid | Tax Assessment Tax Assessment Total Assessment is a certain percentage of the fair market value that is determined by local assessors to be the total taxable value of land and additions on the property. | Land | Improvement |
|---|---|---|---|---|
| 2024 | $4,436 | $192,008 | $30,800 | $161,208 |
| 2023 | $3,914 | $184,160 | $30,800 | $153,360 |
| 2022 | $4,078 | $159,000 | $30,800 | $128,200 |
| 2021 | $3,707 | $127,840 | $20,000 | $107,840 |
| 2020 | $3,813 | $125,360 | $20,000 | $105,360 |
| 2019 | $3,550 | $115,720 | $20,000 | $95,720 |
| 2018 | $3,601 | $116,160 | $20,000 | $96,160 |
| 2017 | $3,316 | $113,080 | $20,000 | $93,080 |
| 2016 | $3,060 | $102,360 | $17,600 | $84,760 |
| 2015 | $3,036 | $99,800 | $17,600 | $82,200 |
| 2014 | $2,662 | $86,240 | $17,600 | $68,640 |
| 2013 | -- | $85,160 | $0 | $0 |
Source: Public Records
Map
Nearby Homes
- 262 Otter Cir
- 322 Hambrick Park
- 490 Grand Teton Cir
- 470 Grand Teton Cir
- 180 Sunderland Cir
- 360 Grand Teton Cir
- 335 Grand Teton Cir
- 125 Nina Celeste Ln
- 120 Godby Dr
- 155 Mine Run
- 175 Ferncliff
- 215 Wallace St
- 0 S Sandy Creek Rd Unit 10588191
- 140 Rockglen Ct
- 140 Ridgecrest Dr Unit 2
- 165 Blackjack Ct
- 155 Cottage Cir
- 135 Waterlace Way
- 230 Hidden Brook Trail
- 2051 Forest Dr
- 249 Otter Cir Unit 46
- 249 Otter Cir Unit N/
- 251 Otter Cir
- 247 Otter Cir
- 248 Otter Cir
- 246 Otter Cir
- 245 Otter Cir
- 250 Otter Cir
- 244 Otter Cir
- 252 Otter Cir
- 253 Otter Cir
- 243 Otter Cir
- 312 Hambrick Park
- 242 Otter Cir
- 310 Hambrick Park
- 314 Hambrick Park Unit 116
- 314 Hambrick Park
- 254 Otter Cir Unit 126
- 254 Otter Cir
- 316 Hambrick Park