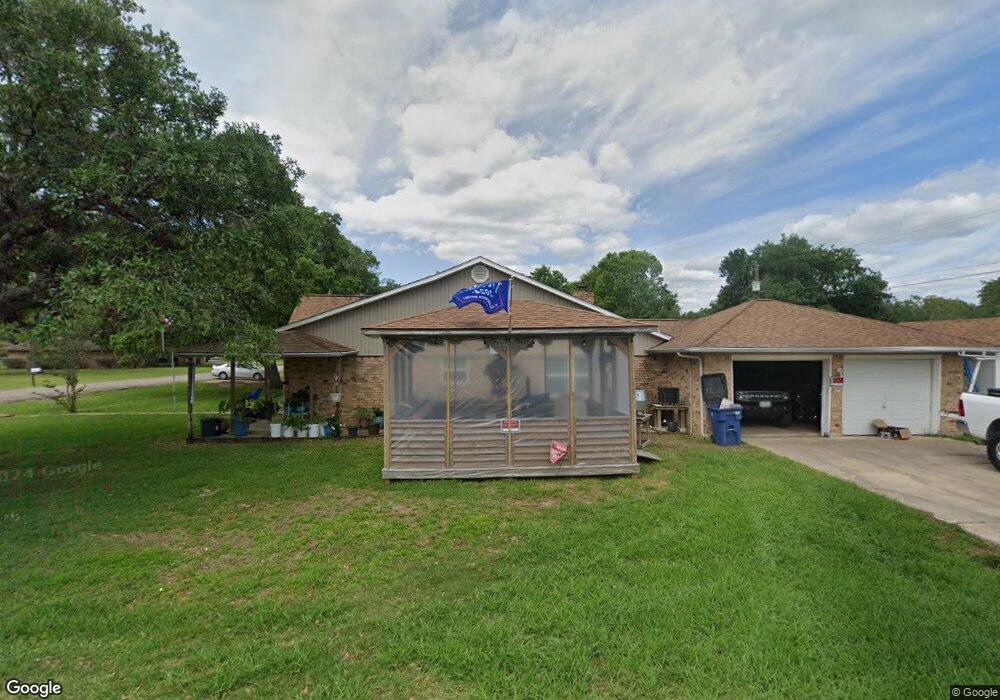
249 Pecan Dr Brazoria, TX 77422
Estimated Value: $270,434 - $322,000
3
Beds
2
Baths
1,400
Sq Ft
$209/Sq Ft
Est. Value
About This Home
This home is located at 249 Pecan Dr, Brazoria, TX 77422 and is currently estimated at $292,109, approximately $208 per square foot. 249 Pecan Dr is a home located in Brazoria County.
Ownership History
Date
Name
Owned For
Owner Type
Purchase Details
Closed on
Mar 1, 2022
Sold by
Wilbeck Dorothy F
Bought by
Wilbeck Dorothy F
Current Estimated Value
Purchase Details
Closed on
Dec 28, 2004
Sold by
Peredo Margaret Dee
Bought by
Dickerson Margaret and Dickerson Glen
Home Financials for this Owner
Home Financials are based on the most recent Mortgage that was taken out on this home.
Original Mortgage
$88,000
Interest Rate
5.74%
Mortgage Type
Stand Alone First
Purchase Details
Closed on
Aug 10, 1998
Sold by
Federal National Mortgage Association
Bought by
Peredo Margaret Dee
Home Financials for this Owner
Home Financials are based on the most recent Mortgage that was taken out on this home.
Original Mortgage
$74,335
Interest Rate
6.95%
Mortgage Type
FHA
Purchase Details
Closed on
Mar 3, 1998
Sold by
Chevalier Edwin Keith and Chevalier Felicia Ray
Bought by
First Commercial Mtg Co
Purchase Details
Closed on
Jul 7, 1995
Sold by
Zamora Leonel and Zamora Alicia G
Bought by
Chevalier Edwin K and Chevalier Felicia F
Create a Home Valuation Report for This Property
The Home Valuation Report is an in-depth analysis detailing your home's value as well as a comparison with similar homes in the area
Home Values in the Area
Average Home Value in this Area
Purchase History
| Date | Buyer | Sale Price | Title Company |
|---|---|---|---|
| Wilbeck Dorothy F | -- | None Listed On Document | |
| Dickerson Margaret | -- | Fidelity National Title | |
| Peredo Margaret Dee | -- | -- | |
| First Commercial Mtg Co | $66,600 | -- | |
| Chevalier Edwin K | -- | -- |
Source: Public Records
Mortgage History
| Date | Status | Borrower | Loan Amount |
|---|---|---|---|
| Previous Owner | Dickerson Margaret | $88,000 | |
| Previous Owner | Peredo Margaret Dee | $74,335 |
Source: Public Records
Tax History Compared to Growth
Tax History
| Year | Tax Paid | Tax Assessment Tax Assessment Total Assessment is a certain percentage of the fair market value that is determined by local assessors to be the total taxable value of land and additions on the property. | Land | Improvement |
|---|---|---|---|---|
| 2025 | $1,213 | $183,189 | $19,280 | $173,120 |
| 2023 | $1,213 | $151,395 | $17,440 | $213,330 |
| 2022 | $3,109 | $137,632 | $15,390 | $165,730 |
| 2021 | $2,949 | $125,120 | $13,340 | $111,780 |
| 2020 | $3,055 | $123,500 | $12,310 | $111,190 |
| 2019 | $3,265 | $127,910 | $10,260 | $117,650 |
| 2018 | $2,999 | $116,850 | $12,310 | $104,540 |
| 2017 | $2,983 | $112,390 | $12,310 | $100,080 |
| 2016 | $2,808 | $105,800 | $10,260 | $95,540 |
| 2014 | $2,400 | $109,000 | $10,260 | $98,740 |
Source: Public Records
Map
Nearby Homes
- 232 Magnolia St
- 0 Pecan Dr
- 409 Carlton St
- 229 Yaupon Dr
- 523 Lazy Ln
- 307 Avenue G
- 706 E New York St
- 230 E New York St
- 549 E New York St
- 1208 S Brooks St
- 4773 County Road 652
- 34654 Fm 521 Rd
- 8922 Fm 521 Rd
- 310 E Texas St
- 401 E Texas St
- 0 Cr-747a
- TBD Cr-318
- 320 Cr-320
- 0 Cr-318 Unit 18304666
- TBD Cr-318 Tract 7c