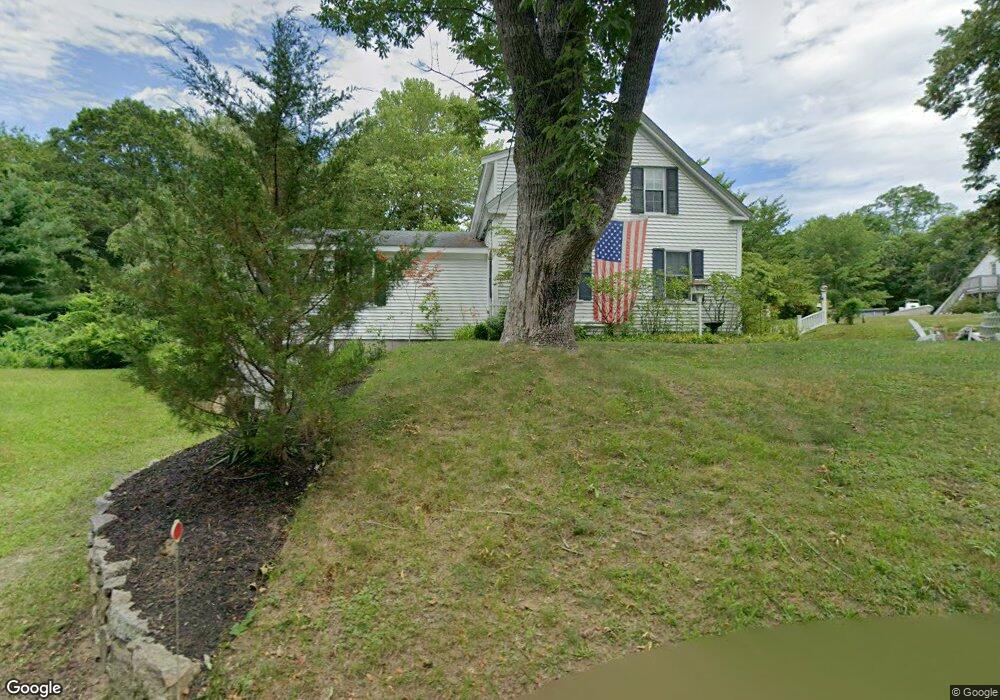
249 Pine St Duxbury, MA 02332
Estimated Value: $779,000 - $843,000
4
Beds
3
Baths
2,518
Sq Ft
$325/Sq Ft
Est. Value
About This Home
This home is located at 249 Pine St, Duxbury, MA 02332 and is currently estimated at $819,598, approximately $325 per square foot. 249 Pine St is a home located in Plymouth County with nearby schools including Chandler Elementary School, Alden School, and Duxbury Middle School.
Ownership History
Date
Name
Owned For
Owner Type
Purchase Details
Closed on
Feb 8, 1967
Bought by
Christenson Donald C and Christenson Janet E
Current Estimated Value
Create a Home Valuation Report for This Property
The Home Valuation Report is an in-depth analysis detailing your home's value as well as a comparison with similar homes in the area
Home Values in the Area
Average Home Value in this Area
Purchase History
| Date | Buyer | Sale Price | Title Company |
|---|---|---|---|
| Christenson Donald C | -- | -- |
Source: Public Records
Mortgage History
| Date | Status | Borrower | Loan Amount |
|---|---|---|---|
| Open | Christenson Donald C | $110,000 |
Source: Public Records
Tax History
| Year | Tax Paid | Tax Assessment Tax Assessment Total Assessment is a certain percentage of the fair market value that is determined by local assessors to be the total taxable value of land and additions on the property. | Land | Improvement |
|---|---|---|---|---|
| 2025 | $7,252 | $715,200 | $354,900 | $360,300 |
| 2024 | $7,359 | $731,500 | $354,900 | $376,600 |
| 2023 | $7,797 | $729,400 | $369,100 | $360,300 |
| 2022 | $8,052 | $627,100 | $303,900 | $323,200 |
| 2021 | $240 | $574,100 | $253,300 | $320,800 |
| 2020 | $236 | $543,800 | $255,300 | $288,500 |
| 2019 | $8,123 | $527,100 | $212,700 | $314,400 |
| 2018 | $7,779 | $513,100 | $197,700 | $315,400 |
| 2017 | $8,338 | $490,300 | $184,800 | $305,500 |
| 2016 | $7,624 | $490,300 | $184,800 | $305,500 |
| 2015 | $7,282 | $466,800 | $161,300 | $305,500 |
Source: Public Records
Map
Nearby Homes
- 171 Pine St
- 7 Green Holly Dr
- 346 Summer St
- 7 Bassett Brook Ln
- 100 Valley St
- 0 Kingstown Way
- 17 Trout Farm Ln
- 6 Kingstown Way
- 25 Carriage Ln Unit 25
- 0 East St
- 34 Winter St
- 26 Jessica Cir
- 167 Grove St
- 25 Little Brook Rd
- 32 Little Brook Rd
- 35 Grove St
- 46 Foxworth Ln
- 2 Clinton Terrace
- 25 Gardner Rd
- 4 Treetop Ln Unit 4
Your Personal Tour Guide
Ask me questions while you tour the home.