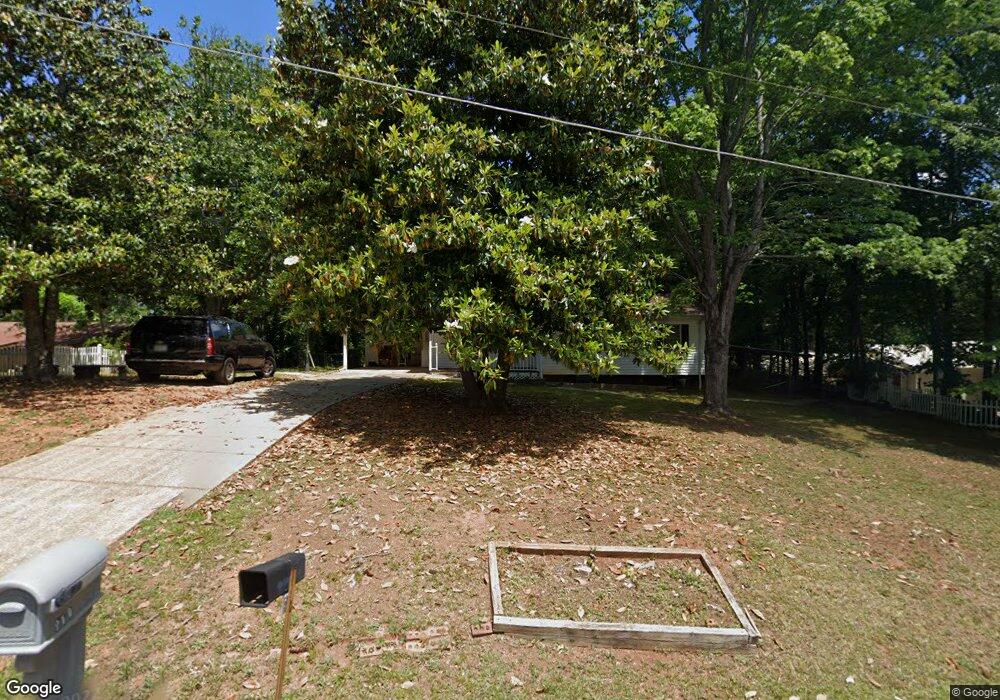
249 Red Fox Hollow Rd Cornelia, GA 30531
Estimated Value: $243,000 - $276,000
3
Beds
2
Baths
1,276
Sq Ft
$201/Sq Ft
Est. Value
About This Home
This home is located at 249 Red Fox Hollow Rd, Cornelia, GA 30531 and is currently estimated at $256,638, approximately $201 per square foot. 249 Red Fox Hollow Rd is a home located in Habersham County with nearby schools including Cornelia Elementary School, Habersham Success Academy, and Wilbanks Middle School.
Ownership History
Date
Name
Owned For
Owner Type
Purchase Details
Closed on
Apr 23, 2021
Sold by
Torres Pablo
Bought by
Garrido Israel Vega
Current Estimated Value
Home Financials for this Owner
Home Financials are based on the most recent Mortgage that was taken out on this home.
Original Mortgage
$176,641
Outstanding Balance
$159,740
Interest Rate
3.1%
Mortgage Type
FHA
Estimated Equity
$96,898
Purchase Details
Closed on
Oct 23, 2020
Sold by
In And Out Home Buyers Llc
Bought by
Torres Pablo
Purchase Details
Closed on
Oct 15, 2020
Sold by
Blair Nathan Christopher
Bought by
In And Out Home Buyers Llc
Purchase Details
Closed on
Jun 7, 2011
Sold by
Llorens Ruth
Bought by
Blair Nathan Christopher
Home Financials for this Owner
Home Financials are based on the most recent Mortgage that was taken out on this home.
Original Mortgage
$66,839
Interest Rate
4.65%
Mortgage Type
New Conventional
Create a Home Valuation Report for This Property
The Home Valuation Report is an in-depth analysis detailing your home's value as well as a comparison with similar homes in the area
Home Values in the Area
Average Home Value in this Area
Purchase History
| Date | Buyer | Sale Price | Title Company |
|---|---|---|---|
| Garrido Israel Vega | $179,900 | -- | |
| Torres Pablo | $103,000 | -- | |
| In And Out Home Buyers Llc | $65,000 | -- | |
| Blair Nathan Christopher | $60,000 | -- |
Source: Public Records
Mortgage History
| Date | Status | Borrower | Loan Amount |
|---|---|---|---|
| Open | Garrido Israel Vega | $176,641 | |
| Previous Owner | Blair Nathan Christopher | $66,839 |
Source: Public Records
Tax History Compared to Growth
Tax History
| Year | Tax Paid | Tax Assessment Tax Assessment Total Assessment is a certain percentage of the fair market value that is determined by local assessors to be the total taxable value of land and additions on the property. | Land | Improvement |
|---|---|---|---|---|
| 2025 | $3,223 | $95,766 | $16,000 | $79,766 |
| 2024 | $2,284 | $88,016 | $12,000 | $76,016 |
| 2023 | $1,864 | $74,568 | $12,000 | $62,568 |
| 2022 | $1,692 | $64,900 | $12,000 | $52,900 |
| 2021 | $1,319 | $50,808 | $10,000 | $40,808 |
| 2020 | $702 | $26,096 | $6,000 | $20,096 |
| 2019 | $703 | $26,096 | $6,000 | $20,096 |
| 2018 | $697 | $26,096 | $6,000 | $20,096 |
| 2017 | $657 | $24,448 | $6,000 | $18,448 |
| 2016 | $637 | $61,120 | $6,000 | $18,448 |
| 2015 | $630 | $61,120 | $6,000 | $18,448 |
| 2014 | $630 | $60,000 | $6,000 | $18,000 |
| 2013 | -- | $24,000 | $6,000 | $18,000 |
Source: Public Records
Map
Nearby Homes
- 240 Sugar Maple Dr
- 600 Elrod St
- 133 Hillandale St
- 272 Crepe Myrtle St
- 292 Chenocetah Dr
- 296 Grand Ave
- 820 Camp Creek Rd
- 227 Short Ave
- 266 Short Ave
- 530 Grandview Ave
- 952 Wayside St NW
- 1576 Chase Rd
- 175 Hillcrest St
- 795 Wayside St
- 283 Yonah St
- 134 Hillcrest St
- 600 Hoyt St
- 113 Foster St NW
- 142 Galloway St
- 271 Modoc Dr
- 249 Red Fox Hollow Dr
- 273 Red Fox Hollow Rd
- 225 Red Fox Hollow Rd
- 0 Red Fox Hollow Dr Unit 8825224
- 0 Red Fox Hollow Dr Unit 8874362
- 232 Red Fox Hollow Rd
- 295 Red Fox Hollow Rd
- 284 Red Fox Hollow Rd
- 153 Fox Hollow Rd
- 198 Sugar Creek Dr
- 197 Fox Hollow Rd
- 174 Red Fox Hollow Rd
- 319 Red Fox Hollow Rd
- 194 Sugar Creek Dr
- 304 Red Fox Hollow Rd
- 195 Sugar Creek Dr
- 188 Sugar Creek Dr
- 233 Fox Hollow Rd
- 361 Red Fox Hollow Rd
- 187 Red Fox Hollow Rd