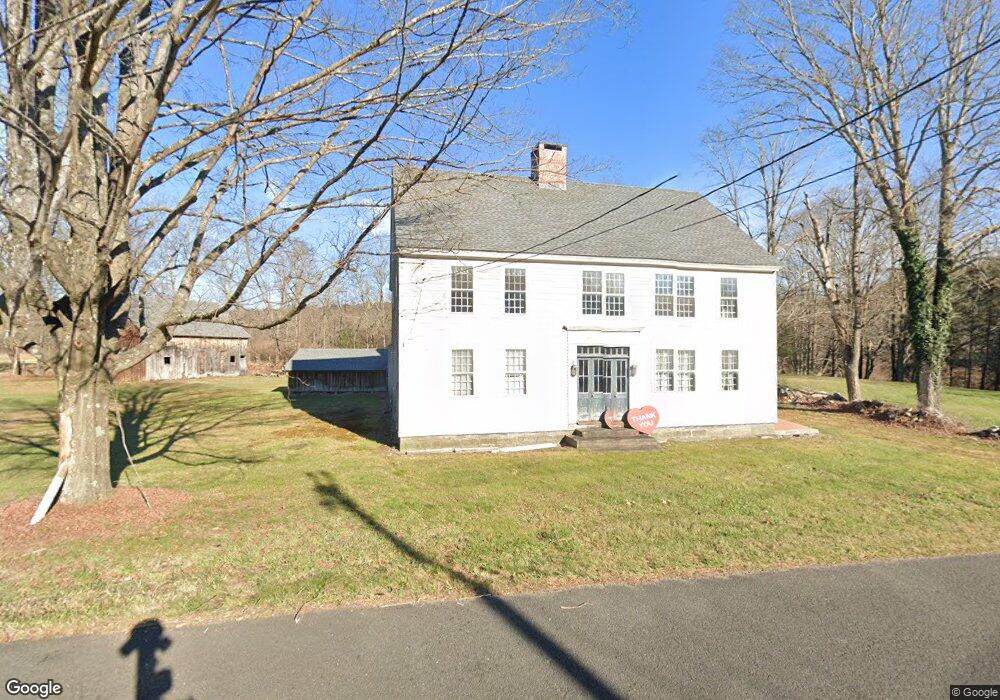
249 Route 6 Andover, CT 06232
Estimated Value: $366,099 - $438,000
3
Beds
2
Baths
3,329
Sq Ft
$121/Sq Ft
Est. Value
About This Home
This home is located at 249 Route 6, Andover, CT 06232 and is currently estimated at $404,025, approximately $121 per square foot. 249 Route 6 is a home located in Tolland County with nearby schools including Andover Elementary School, RHAM Middle School, and RHAM High School.
Ownership History
Date
Name
Owned For
Owner Type
Purchase Details
Closed on
Mar 2, 2020
Sold by
M Dion Development Llc
Bought by
Dion Properties Llc
Current Estimated Value
Purchase Details
Closed on
Jun 18, 2007
Sold by
Roberts Howard
Bought by
M Dion Development Llc
Create a Home Valuation Report for This Property
The Home Valuation Report is an in-depth analysis detailing your home's value as well as a comparison with similar homes in the area
Home Values in the Area
Average Home Value in this Area
Purchase History
| Date | Buyer | Sale Price | Title Company |
|---|---|---|---|
| Dion Properties Llc | -- | None Available | |
| Dion Properties Llc | -- | None Available | |
| M Dion Development Llc | $245,000 | -- | |
| M Dion Development Llc | $245,000 | -- |
Source: Public Records
Mortgage History
| Date | Status | Borrower | Loan Amount |
|---|---|---|---|
| Previous Owner | M Dion Development Llc | $153,357 | |
| Previous Owner | M Dion Development Llc | $121,600 | |
| Previous Owner | M Dion Development Llc | $142,500 |
Source: Public Records
Tax History
| Year | Tax Paid | Tax Assessment Tax Assessment Total Assessment is a certain percentage of the fair market value that is determined by local assessors to be the total taxable value of land and additions on the property. | Land | Improvement |
|---|---|---|---|---|
| 2025 | $6,079 | $192,430 | $34,650 | $157,780 |
| 2024 | $6,054 | $192,430 | $34,650 | $157,780 |
| 2023 | $6,021 | $192,430 | $34,650 | $157,780 |
| 2022 | $6,140 | $192,430 | $34,650 | $157,780 |
| 2021 | $5,648 | $156,900 | $34,600 | $122,300 |
| 2020 | $5,577 | $156,600 | $34,600 | $122,000 |
| 2019 | $5,479 | $156,600 | $34,600 | $122,000 |
| 2018 | $5,317 | $156,600 | $34,600 | $122,000 |
| 2017 | $5,090 | $156,600 | $34,600 | $122,000 |
| 2016 | $4,903 | $159,600 | $44,000 | $115,600 |
| 2015 | $4,903 | $159,600 | $44,000 | $115,600 |
| 2014 | $4,903 | $159,600 | $44,000 | $115,600 |
Source: Public Records
Map
Nearby Homes
- 0 Us Highway 6
- 0 Wheeling Rd Unit 24116879
- 14 Times Farm Rd
- 8 Times Farm Rd
- 0 Skinner Hill Rd Unit 24077239
- 273 Hebron Rd
- 126 Hebron Rd
- 869 East St
- 34 Hanover Farms Rd
- 9 Tumblebrook Rd
- 24 Brian Dr
- 400 West St
- 0 Hinkel Mae Dr
- 17 Ireland Dr
- 277 Lake Rd
- 27 Fox Trail
- 1 West St
- 687 Hop River Rd
- 559 East St
- 0 Boston Turnpike Unit 24128587
- 254 Route 6
- 233 Route 6
- 151 Wales Building 1 Rd
- 151 Wales (Buildings 1 & 2) Rd
- 151 Wales Rd Unit Bldg 2
- 151 Wales Rd
- 262 Route 6
- 157 Wales Rd
- 272 Jonathan Trumbull Hwy
- 272 Route 6
- 241 Route 6
- 226 Route 6
- 141 Wales Rd
- 0007 Route 6
- 222 Route 6
- 154 Wales Rd
- 219 Route 6
- 133 Wales Rd
- LOT # 7 Route 6
- 225 Route 6
Your Personal Tour Guide
Ask me questions while you tour the home.