Estimated Value: $259,000 - $336,000
5
Beds
3
Baths
1,980
Sq Ft
$159/Sq Ft
Est. Value
About This Home
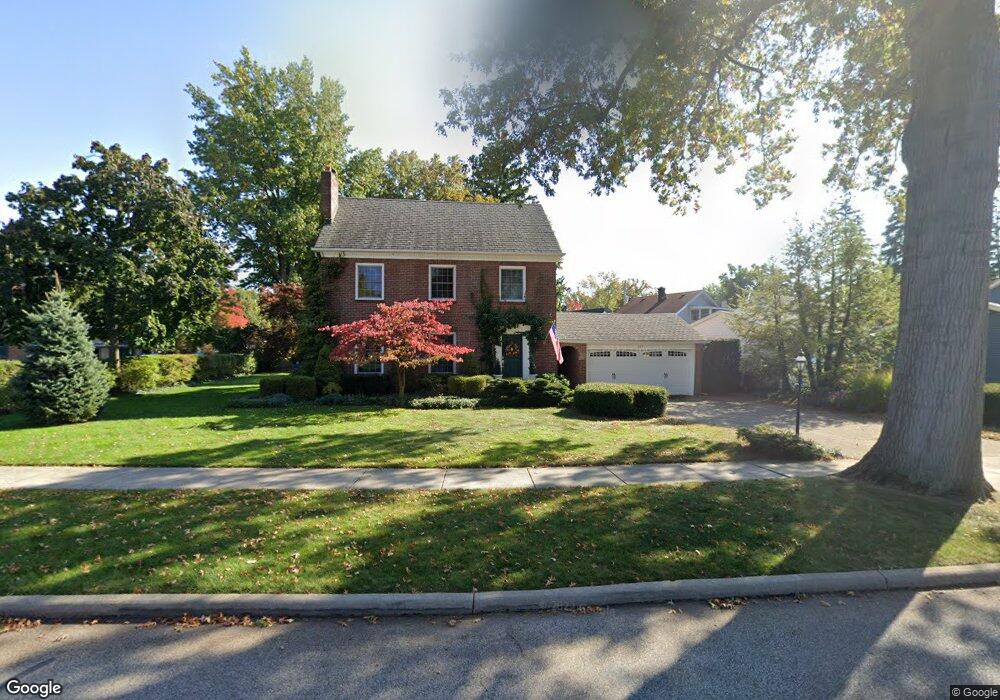
This home is located at 249 Stanford Dr, Berea, OH 44017 and is currently estimated at $315,010, approximately $159 per square foot. 249 Stanford Dr is a home located in Cuyahoga County with nearby schools including Grindstone Elementary School, Berea-Midpark Middle School, and Berea-Midpark High School.
Ownership History
Date
Name
Owned For
Owner Type
Purchase Details
Closed on
Jan 25, 1993
Sold by
Posze Mary Ellen
Bought by
Judson Richard D
Current Estimated Value
Purchase Details
Closed on
Oct 19, 1981
Sold by
Bright Richard H and Bright Elaine B
Bought by
Posze Mary Ellen
Purchase Details
Closed on
Jan 1, 1975
Bought by
Bright Richard H and Bright Elaine B
Create a Home Valuation Report for This Property
The Home Valuation Report is an in-depth analysis detailing your home's value as well as a comparison with similar homes in the area
Home Values in the Area
Average Home Value in this Area
Purchase History
| Date | Buyer | Sale Price | Title Company |
|---|---|---|---|
| Judson Richard D | $179,800 | -- | |
| Posze Mary Ellen | $105,000 | -- | |
| Bright Richard H | -- | -- |
Source: Public Records
Tax History
| Year | Tax Paid | Tax Assessment Tax Assessment Total Assessment is a certain percentage of the fair market value that is determined by local assessors to be the total taxable value of land and additions on the property. | Land | Improvement |
|---|---|---|---|---|
| 2024 | $6,008 | $103,950 | $16,625 | $87,325 |
| 2023 | $5,127 | $74,240 | $13,300 | $60,940 |
| 2022 | $5,095 | $74,240 | $13,300 | $60,940 |
| 2021 | $5,052 | $74,240 | $13,300 | $60,940 |
| 2020 | $4,825 | $62,900 | $11,270 | $51,630 |
| 2019 | $4,696 | $179,700 | $32,200 | $147,500 |
| 2018 | $4,934 | $62,900 | $11,270 | $51,630 |
| 2017 | $5,559 | $69,480 | $12,780 | $56,700 |
| 2016 | $5,518 | $69,480 | $12,780 | $56,700 |
| 2015 | $5,214 | $69,480 | $12,780 | $56,700 |
| 2014 | $5,214 | $69,480 | $12,780 | $56,700 |
Source: Public Records
Map
Nearby Homes
- 211 W Bridge St
- 200 Gibson St
- 209 Gibson St
- 160 Marian Ln Unit 6A
- 146 Marian Ln
- 216 Kraft St
- 47 Prospect St
- 50 S Rocky River Dr Unit 206
- 246 Kempton Dr
- 300 West St
- 404 Crescent Dr
- 93 W 5th Ave
- 115 S Rocky River Dr Unit 201
- 388 Fairwood Cir
- 445 Berea St
- 41 W 5th Ave
- 452 N Rocky River Dr
- 628 Lindbergh Blvd
- 487 Karen Dr
- 344 Girard Dr