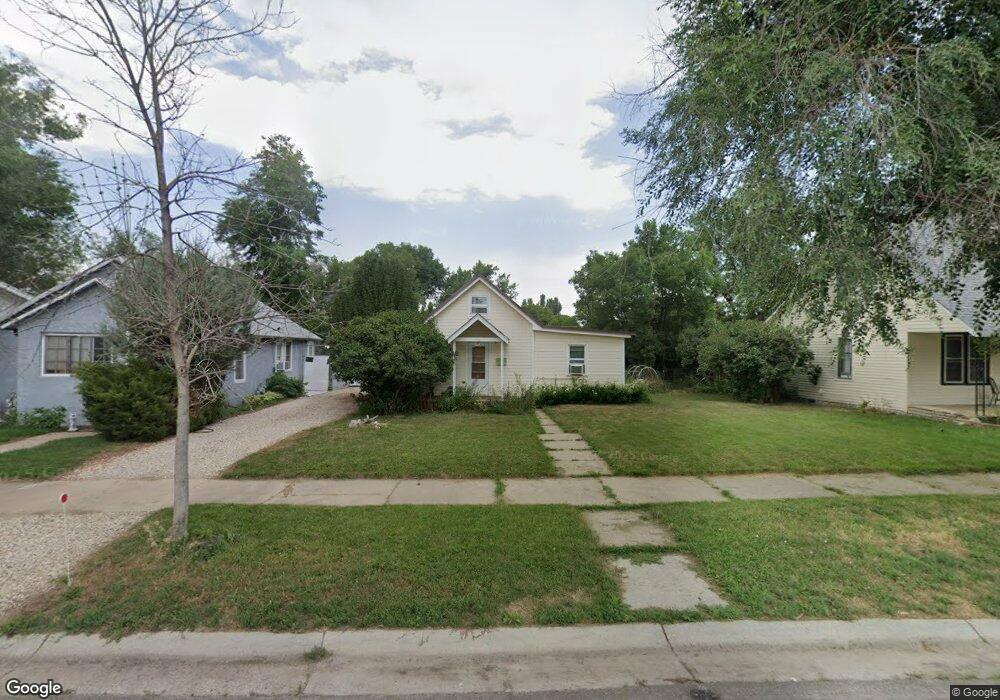
249 W 7th St Sheridan, WY 82801
Estimated Value: $178,000 - $289,000
1
Bed
1
Bath
621
Sq Ft
$359/Sq Ft
Est. Value
About This Home
This home is located at 249 W 7th St, Sheridan, WY 82801 and is currently estimated at $222,775, approximately $358 per square foot. 249 W 7th St is a home with nearby schools including Sheridan High School, Holy Name Catholic School, and Martin Luther Grammar School.
Ownership History
Date
Name
Owned For
Owner Type
Purchase Details
Closed on
Sep 2, 2025
Sold by
Cole Dean
Bought by
Broadway David
Current Estimated Value
Home Financials for this Owner
Home Financials are based on the most recent Mortgage that was taken out on this home.
Original Mortgage
$165,447
Outstanding Balance
$165,161
Interest Rate
6.75%
Mortgage Type
FHA
Estimated Equity
$57,614
Purchase Details
Closed on
Feb 11, 2013
Sold by
Good Faith S
Bought by
Cole Dean
Home Financials for this Owner
Home Financials are based on the most recent Mortgage that was taken out on this home.
Original Mortgage
$49,200
Interest Rate
3.44%
Mortgage Type
New Conventional
Purchase Details
Closed on
Aug 24, 2007
Sold by
Slaybaugh Garrett Tyler and Slaybaugh Sue Ellen
Bought by
Good Faith S
Home Financials for this Owner
Home Financials are based on the most recent Mortgage that was taken out on this home.
Original Mortgage
$84,100
Interest Rate
6.72%
Mortgage Type
New Conventional
Purchase Details
Closed on
Apr 6, 2006
Sold by
Quintana Julio G
Bought by
Slaybaugh Garrett T and Slaybaugh Sue Ellen
Home Financials for this Owner
Home Financials are based on the most recent Mortgage that was taken out on this home.
Original Mortgage
$12,200
Interest Rate
6.32%
Mortgage Type
Stand Alone Second
Create a Home Valuation Report for This Property
The Home Valuation Report is an in-depth analysis detailing your home's value as well as a comparison with similar homes in the area
Home Values in the Area
Average Home Value in this Area
Purchase History
| Date | Buyer | Sale Price | Title Company |
|---|---|---|---|
| Broadway David | -- | None Listed On Document | |
| Cole Dean | -- | None Available | |
| Good Faith S | -- | None Available | |
| Slaybaugh Garrett T | -- | None Available |
Source: Public Records
Mortgage History
| Date | Status | Borrower | Loan Amount |
|---|---|---|---|
| Open | Broadway David | $165,447 | |
| Closed | Broadway David | $11,290 | |
| Previous Owner | Cole Dean | $49,200 | |
| Previous Owner | Good Faith S | $84,100 | |
| Previous Owner | Slaybaugh Garrett T | $12,200 | |
| Previous Owner | Slaybaugh Garrett T | $48,800 |
Source: Public Records
Tax History Compared to Growth
Tax History
| Year | Tax Paid | Tax Assessment Tax Assessment Total Assessment is a certain percentage of the fair market value that is determined by local assessors to be the total taxable value of land and additions on the property. | Land | Improvement |
|---|---|---|---|---|
| 2025 | $889 | $9,692 | $5,879 | $3,813 |
| 2024 | $889 | $12,433 | $7,537 | $4,896 |
| 2023 | $843 | $11,788 | $6,973 | $4,815 |
| 2022 | $704 | $9,849 | $5,549 | $4,300 |
| 2021 | $593 | $8,294 | $4,584 | $3,710 |
| 2020 | $565 | $7,906 | $4,456 | $3,450 |
| 2019 | $516 | $7,213 | $3,963 | $3,250 |
| 2018 | $498 | $6,962 | $3,862 | $3,100 |
| 2017 | $488 | $6,827 | $3,862 | $2,965 |
| 2015 | $386 | $5,393 | $2,437 | $2,956 |
| 2014 | $381 | $5,326 | $2,437 | $2,889 |
| 2013 | -- | $6,171 | $3,273 | $2,898 |
Source: Public Records
Map
Nearby Homes
- 216 W 7th St
- 1030 N Main St Unit 110
- 148 W 5th St
- 945 Bellevue Ave
- 1147 N Gould St
- 505 W 8th St
- 1349 Dana Ave
- 1405 Ridgeway Ave
- 262 Lewis St
- 426 W 11th St
- 430 W 11th St
- 1441 Dana Ave
- 0 Bellevue Ave
- 1436 N Gould St
- 1430 Omarr Ave
- 1507 Omarr Ave
- 1606 Omarr Ave
- 904 N Sheridan Ave
- 924 Avon St
- 925 N Sheridan Ave