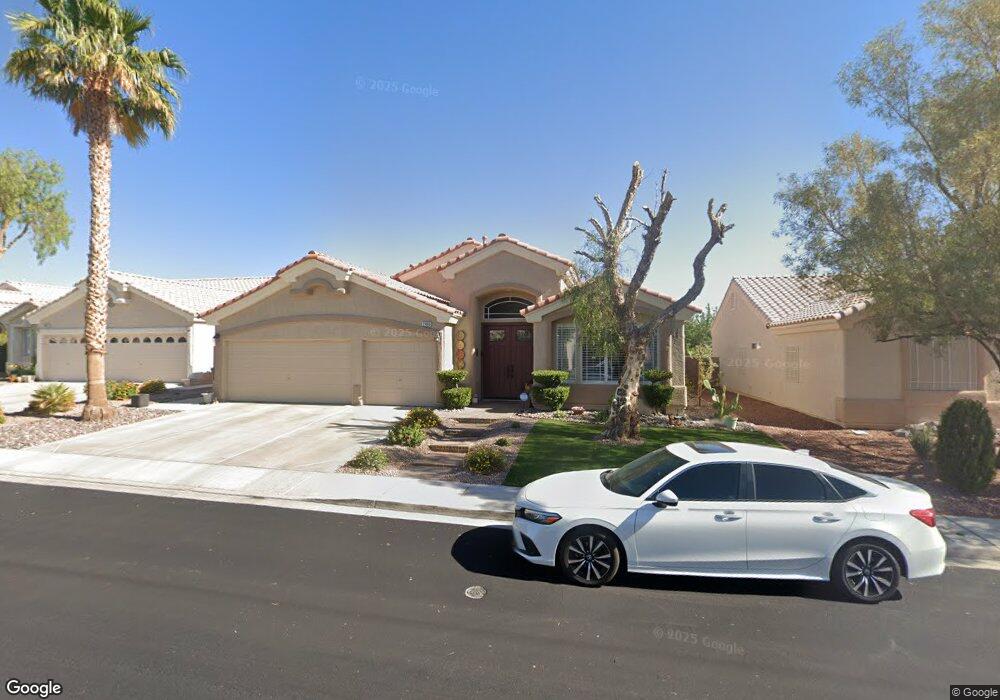
2490 Abbeystone Cir Henderson, NV 89052
MacDonald Ranch NeighborhoodEstimated Value: $603,439 - $720,000
4
Beds
3
Baths
2,435
Sq Ft
$269/Sq Ft
Est. Value
About This Home
This home is located at 2490 Abbeystone Cir, Henderson, NV 89052 and is currently estimated at $654,610, approximately $268 per square foot. 2490 Abbeystone Cir is a home located in Clark County with nearby schools including Frank S Lamping Elementary School, Del E. Webb Middle School, and Coronado High School.
Ownership History
Date
Name
Owned For
Owner Type
Purchase Details
Closed on
Feb 17, 2012
Sold by
Pamblanco Francisco and Pamblanco Maria T
Bought by
Pamblanco Francisco and Pamblanco Maria T
Current Estimated Value
Purchase Details
Closed on
Sep 15, 2004
Sold by
Greeves Llc
Bought by
Pamblanco Francisco and Pamblanco Maria T
Home Financials for this Owner
Home Financials are based on the most recent Mortgage that was taken out on this home.
Original Mortgage
$344,000
Outstanding Balance
$164,119
Interest Rate
5.75%
Mortgage Type
Purchase Money Mortgage
Estimated Equity
$490,491
Purchase Details
Closed on
May 14, 2004
Sold by
Torello Frank J and Torello Bernadette M
Bought by
Greeves Llc
Purchase Details
Closed on
Apr 19, 1999
Sold by
D R Horton Inc
Bought by
Torello Frank J and Torello Bernadette M
Home Financials for this Owner
Home Financials are based on the most recent Mortgage that was taken out on this home.
Original Mortgage
$164,650
Interest Rate
9.5%
Create a Home Valuation Report for This Property
The Home Valuation Report is an in-depth analysis detailing your home's value as well as a comparison with similar homes in the area
Home Values in the Area
Average Home Value in this Area
Purchase History
| Date | Buyer | Sale Price | Title Company |
|---|---|---|---|
| Pamblanco Francisco | -- | None Available | |
| Pamblanco Francisco | $430,000 | National Title Company | |
| Greeves Llc | $105,000 | National Title Company | |
| Torello Frank J | $183,000 | Old Republic Title Company |
Source: Public Records
Mortgage History
| Date | Status | Borrower | Loan Amount |
|---|---|---|---|
| Open | Pamblanco Francisco | $344,000 | |
| Previous Owner | Torello Frank J | $164,650 | |
| Closed | Pamblanco Francisco | $64,500 |
Source: Public Records
Tax History
| Year | Tax Paid | Tax Assessment Tax Assessment Total Assessment is a certain percentage of the fair market value that is determined by local assessors to be the total taxable value of land and additions on the property. | Land | Improvement |
|---|---|---|---|---|
| 2026 | $3,091 | $147,656 | $55,300 | $92,356 |
| 2025 | $3,001 | $150,035 | $56,000 | $94,035 |
| 2024 | $2,914 | $150,035 | $56,000 | $94,035 |
| 2023 | $2,914 | $136,402 | $46,900 | $89,502 |
| 2022 | $2,829 | $119,462 | $37,800 | $81,662 |
| 2021 | $2,747 | $112,168 | $34,300 | $77,868 |
| 2020 | $2,664 | $111,495 | $34,300 | $77,195 |
| 2019 | $2,632 | $106,800 | $30,800 | $76,000 |
| 2018 | $2,511 | $97,711 | $24,500 | $73,211 |
| 2017 | $2,823 | $97,400 | $23,100 | $74,300 |
| 2016 | $2,351 | $94,605 | $19,250 | $75,355 |
| 2015 | $2,346 | $86,330 | $15,750 | $70,580 |
| 2014 | $2,277 | $76,272 | $12,250 | $64,022 |
Source: Public Records
Map
Nearby Homes
- 2311 Silver Crew Pass
- 2399 Winter Cliffs St
- 2382 Sunburst View St
- 1095 Snow Roof Ave
- 1071 Snow Roof Ave
- 2278 Smokey Sky Dr
- 1104 Winter Storm Dr
- 2280 Bull Lake Dr
- 990 Crescent Meadows Ct Unit 3
- 2266 Laramine River Dr
- 2266 Driftwood Tide Ave
- 1028 Triumphant St
- 2306 Tedesca Dr
- 1378 Couperin Dr
- 1119 Pinto Horse Ave
- 1026 Belle River Ct
- 2274 Moresca Ave
- 2273 Moresca Ave
- 2288 Tedesca Dr Unit 4
- 2285 Moresca Ave
- 2488 Abbeystone Cir
- 2492 Abbeystone Cir
- 2491 Hoopes Ave
- 2489 Hoopes Ave
- 2486 Abbeystone Cir
- 2494 Abbeystone Cir
- 2493 Hoopes Ave
- 2491 Abbeystone Cir
- 2489 Abbeystone Cir
- 2493 Abbeystone Cir
- 2487 Abbeystone Cir
- 2495 Hoopes Ave
- 2484 Abbeystone Cir
- 2495 Abbeystone Cir
- 1164 Mirage Lake St
- 1166 Mirage Lake St
- 1162 Mirage Lake St
- 2485 Abbeystone Cir
- 1168 Mirage Lake St
- 1160 Mirage Lake St
Your Personal Tour Guide
Ask me questions while you tour the home.