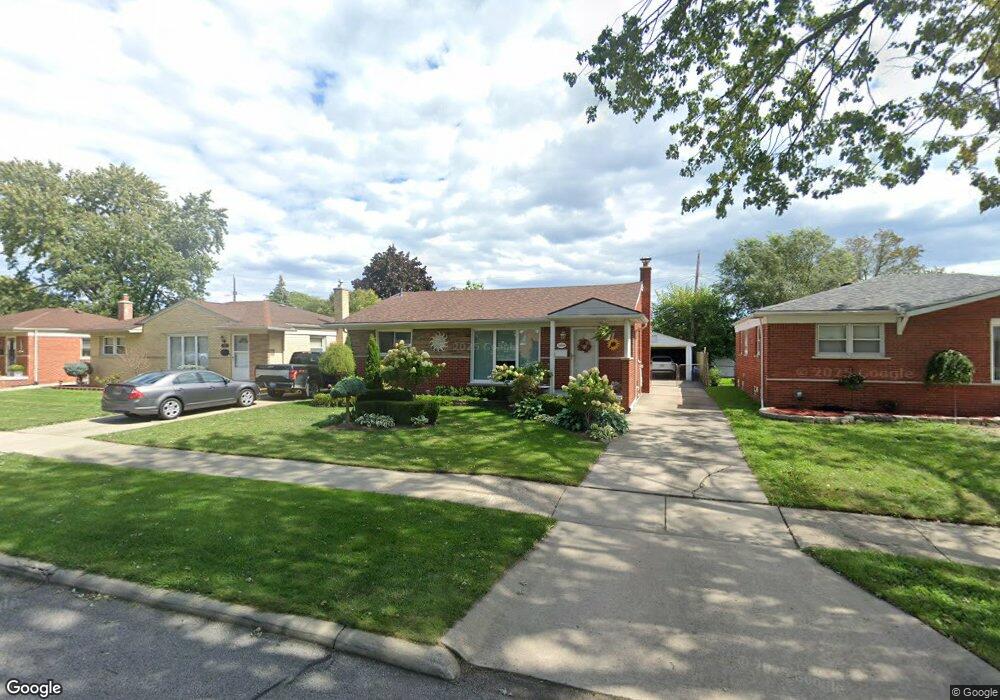
24904 Cubberness St Saint Clair Shores, MI 48080
Estimated Value: $227,000 - $252,000
2
Beds
2
Baths
1,266
Sq Ft
$190/Sq Ft
Est. Value
About This Home
This home is located at 24904 Cubberness St, Saint Clair Shores, MI 48080 and is currently estimated at $240,122, approximately $189 per square foot. 24904 Cubberness St is a home located in Macomb County with nearby schools including Lakeview High School, Reach Charter Academy, and St. Isaac Jogues Elementary School.
Ownership History
Date
Name
Owned For
Owner Type
Purchase Details
Closed on
Oct 15, 2024
Sold by
Sluma Marie Pl
Bought by
Sluma Marie P L and Demers Eric
Current Estimated Value
Purchase Details
Closed on
Nov 2, 2009
Sold by
Saber Robert J and Saber Chastity A
Bought by
Sluma Marie P L
Purchase Details
Closed on
May 1, 2009
Sold by
Mortgage Electronic Registration Systems
Bought by
Lsf6 Mercury Reo Investments Trust Serie
Purchase Details
Closed on
Apr 3, 2009
Sold by
Saber Chastity and Saber Robert
Bought by
Mortgage Electronic Registration Systems
Purchase Details
Closed on
Aug 29, 2003
Sold by
Johnson Richard O and Johnson Patricia
Bought by
Saber Robert and Saber Chastity
Home Financials for this Owner
Home Financials are based on the most recent Mortgage that was taken out on this home.
Original Mortgage
$30,480
Interest Rate
6.04%
Mortgage Type
Balloon
Create a Home Valuation Report for This Property
The Home Valuation Report is an in-depth analysis detailing your home's value as well as a comparison with similar homes in the area
Home Values in the Area
Average Home Value in this Area
Purchase History
| Date | Buyer | Sale Price | Title Company |
|---|---|---|---|
| Sluma Marie P L | -- | None Listed On Document | |
| Sluma Marie P L | $65,300 | Capital Title Insurance Agen | |
| Lsf6 Mercury Reo Investments Trust Serie | -- | None Available | |
| Mortgage Electronic Registration Systems | $23,198 | None Available | |
| Saber Robert | $152,400 | Title One Inc |
Source: Public Records
Mortgage History
| Date | Status | Borrower | Loan Amount |
|---|---|---|---|
| Previous Owner | Saber Robert | $30,480 |
Source: Public Records
Tax History Compared to Growth
Tax History
| Year | Tax Paid | Tax Assessment Tax Assessment Total Assessment is a certain percentage of the fair market value that is determined by local assessors to be the total taxable value of land and additions on the property. | Land | Improvement |
|---|---|---|---|---|
| 2025 | $2,255 | $117,900 | $0 | $0 |
| 2024 | $2,255 | $104,800 | $0 | $0 |
| 2023 | $2,197 | $90,000 | $0 | $0 |
| 2022 | $2,083 | $77,900 | $0 | $0 |
| 2021 | $2,045 | $73,300 | $0 | $0 |
| 2020 | $2,053 | $69,800 | $0 | $0 |
| 2019 | $1,971 | $63,000 | $0 | $0 |
| 2018 | $1,867 | $54,600 | $0 | $0 |
| 2017 | $1,867 | $49,300 | $7,300 | $42,000 |
| 2016 | $1,697 | $49,300 | $0 | $0 |
| 2015 | $1,694 | $43,500 | $0 | $0 |
| 2013 | -- | $36,500 | $0 | $0 |
| 2012 | -- | $37,900 | $6,700 | $31,200 |
Source: Public Records
Map
Nearby Homes
- 24205 Little MacK Ave
- 24201 Little MacK Ave
- 24608 Ursuline St
- 25325 San Rosa Dr
- 24821 Wood St
- 20859 Paloma St
- 24701 Wood St
- 25500 Culver St
- 24609 Wood St
- 25718 Harmon St
- 24509 Wood St
- 24408 Wood St
- 24794 Greenbrier Ave
- 21524 Fresard St
- 24917 Frederick St
- 21536 Downing St
- 24655 Willowby Ave
- 19431 Stephens Dr
- 24675 Ridgecroft Ave
- 26318 San Rosa Dr
- 24816 Cubberness St
- 24912 Cubberness St
- 24905 Harmon St
- 24909 Harmon St
- 24901 Harmon St
- 24817 Harmon St
- 24913 Harmon St
- 24812 Cubberness St
- 24916 Cubberness St
- 24905 Cubberness St
- 24901 Cubberness St
- 24909 Cubberness St
- 24813 Harmon St
- 24915 Harmon St
- 24817 Cubberness St
- 24913 Cubberness St
- 24808 Cubberness St
- 24920 Cubberness St
- 24813 Cubberness St
- 24809 Harmon St