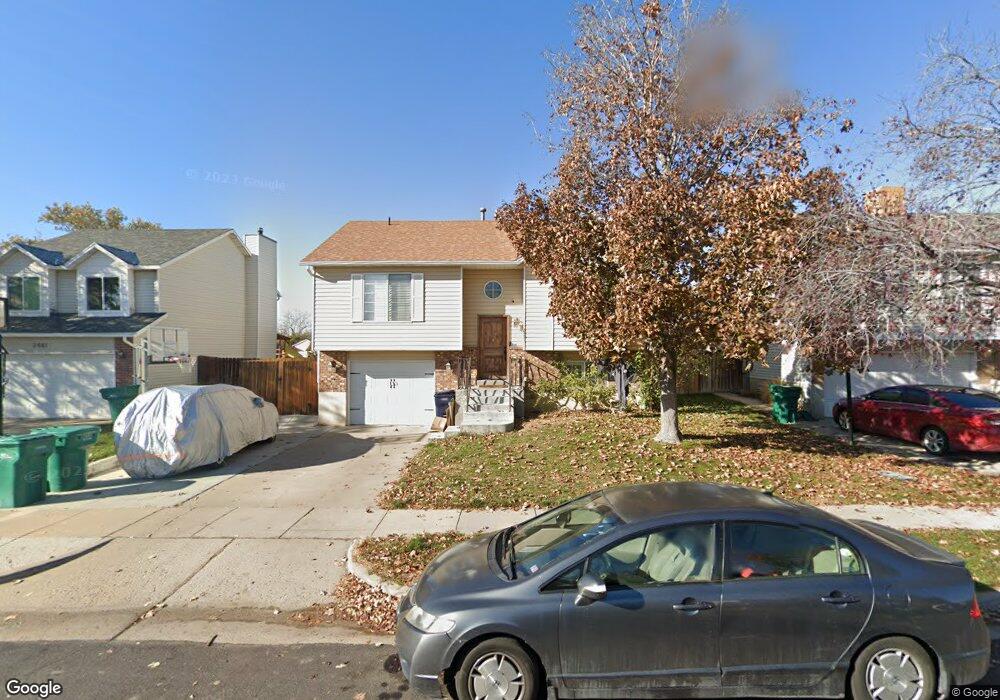
2491 N 1000 W Layton, UT 84041
Estimated Value: $422,660 - $446,000
4
Beds
2
Baths
1,600
Sq Ft
$271/Sq Ft
Est. Value
About This Home
This home is located at 2491 N 1000 W, Layton, UT 84041 and is currently estimated at $433,915, approximately $271 per square foot. 2491 N 1000 W is a home located in Davis County with nearby schools including Lincoln Elementary School, North Layton Junior High School, and Northridge High School.
Ownership History
Date
Name
Owned For
Owner Type
Purchase Details
Closed on
Nov 18, 2014
Sold by
Smith Forrest J and Smith Pamela P
Bought by
Willey Blake and Willey Jia Qiong Z
Current Estimated Value
Purchase Details
Closed on
Feb 10, 2011
Sold by
Smith Forrest and Smith Pamela
Bought by
Smith Forrest J and Smith Pamela P
Home Financials for this Owner
Home Financials are based on the most recent Mortgage that was taken out on this home.
Original Mortgage
$104,030
Interest Rate
4.5%
Mortgage Type
FHA
Purchase Details
Closed on
Apr 29, 1999
Sold by
Fesslee Wesley W and Fessler Carrie Jean
Bought by
Smith Forrest and Smith Pamela
Purchase Details
Closed on
Mar 27, 1996
Sold by
Chatterton Kim J and Chatterton Becky
Bought by
Fessler Wesley W and Fessler Carrie Jean
Home Financials for this Owner
Home Financials are based on the most recent Mortgage that was taken out on this home.
Original Mortgage
$94,062
Interest Rate
6.98%
Mortgage Type
FHA
Create a Home Valuation Report for This Property
The Home Valuation Report is an in-depth analysis detailing your home's value as well as a comparison with similar homes in the area
Home Values in the Area
Average Home Value in this Area
Purchase History
| Date | Buyer | Sale Price | Title Company |
|---|---|---|---|
| Willey Blake | -- | Security Title Of Davis | |
| Smith Forrest J | -- | None Available | |
| Smith Forrest | -- | Avis & Archibald Title | |
| Fessler Wesley W | -- | First American Title Co |
Source: Public Records
Mortgage History
| Date | Status | Borrower | Loan Amount |
|---|---|---|---|
| Previous Owner | Smith Forrest J | $104,030 | |
| Previous Owner | Fessler Wesley W | $94,062 |
Source: Public Records
Tax History Compared to Growth
Tax History
| Year | Tax Paid | Tax Assessment Tax Assessment Total Assessment is a certain percentage of the fair market value that is determined by local assessors to be the total taxable value of land and additions on the property. | Land | Improvement |
|---|---|---|---|---|
| 2025 | $1,907 | $200,200 | $87,361 | $112,839 |
| 2024 | $1,857 | $196,349 | $102,610 | $93,739 |
| 2023 | $1,862 | $190,850 | $71,409 | $119,440 |
| 2022 | $1,907 | $351,000 | $120,499 | $230,501 |
| 2021 | $1,716 | $259,000 | $86,997 | $172,003 |
| 2020 | $1,540 | $223,000 | $75,671 | $147,329 |
| 2019 | $1,558 | $221,000 | $74,193 | $146,807 |
| 2018 | $1,384 | $197,000 | $74,193 | $122,807 |
| 2016 | $1,218 | $89,430 | $22,084 | $67,346 |
| 2015 | $1,142 | $79,640 | $22,084 | $57,556 |
| 2014 | -- | $80,600 | $22,084 | $58,516 |
| 2013 | -- | $79,619 | $20,680 | $58,939 |
Source: Public Records
Map
Nearby Homes
- 2298 N 1085 W
- 1155 W 2200 N
- 2149 N 750 W
- 2887 N 1175 W
- 2949 N 1175 W
- 2211 N 525 W
- 2248 N 500 W
- 506 W 2200 N
- 2233 N 475 W
- 709 W Highway 193
- 1070 S 1650 E
- 865 S 1650 E Unit A
- 2875 N Hill Field Rd Unit 17
- 2875 N Hill Field Rd Unit 199
- 2875 N Hill Field Rd Unit 58
- 2875 N Hill Field Rd Unit 62
- 2875 N Hill Field Rd Unit 40
- 1660 E 900 S Unit 18
- 870 S 1625 E Unit 26 D
- 1548 E 925 S