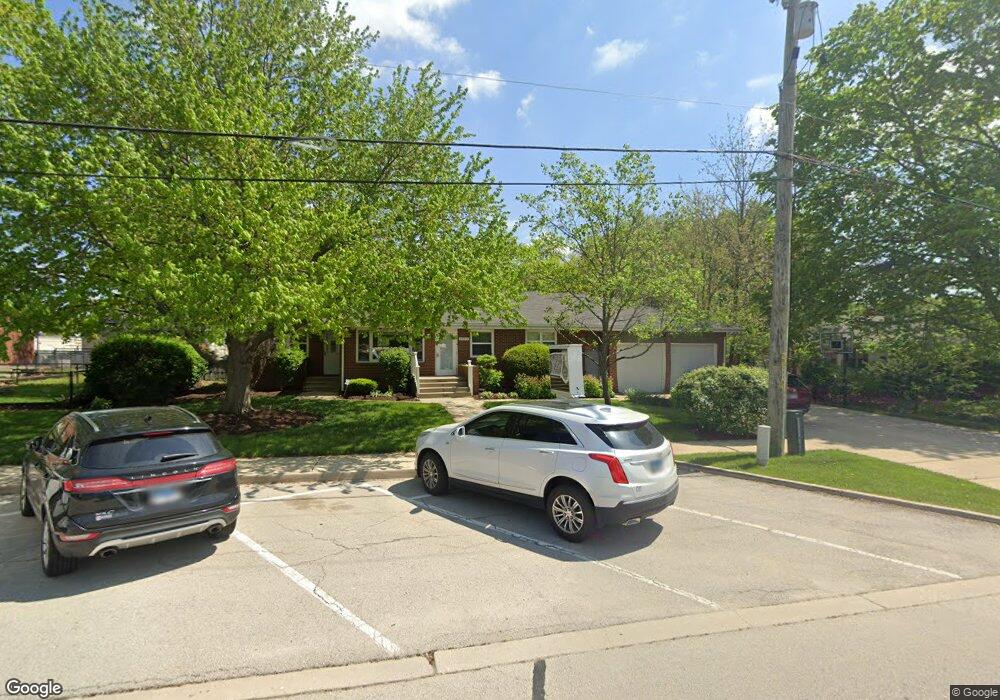
24913 S Sage St Channahon, IL 60410
Estimated Value: $352,716
--
Bed
--
Bath
--
Sq Ft
1,742
Sq Ft Lot
About This Home
This home is located at 24913 S Sage St, Channahon, IL 60410 and is currently estimated at $352,716. 24913 S Sage St is a home located in Will County with nearby schools including N B Galloway Elementary School, Pioneer Path School, and Three Rivers School.
Ownership History
Date
Name
Owned For
Owner Type
Purchase Details
Closed on
Jan 24, 2018
Sold by
Zmk Management Llc
Bought by
Hush Holdings Llc
Current Estimated Value
Home Financials for this Owner
Home Financials are based on the most recent Mortgage that was taken out on this home.
Original Mortgage
$183,600
Outstanding Balance
$154,937
Interest Rate
3.94%
Mortgage Type
Purchase Money Mortgage
Estimated Equity
$197,779
Purchase Details
Closed on
Mar 18, 2014
Sold by
Clusen Judith A and Clusen Paul
Bought by
Zmk Management Llc
Home Financials for this Owner
Home Financials are based on the most recent Mortgage that was taken out on this home.
Original Mortgage
$195,000
Interest Rate
3.25%
Mortgage Type
Commercial
Purchase Details
Closed on
Jul 13, 2007
Sold by
Clusen Paul J
Bought by
Clusen Judith A
Purchase Details
Closed on
Apr 29, 2002
Sold by
Channahon Methodist Church
Bought by
Clusen Paul J
Create a Home Valuation Report for This Property
The Home Valuation Report is an in-depth analysis detailing your home's value as well as a comparison with similar homes in the area
Home Values in the Area
Average Home Value in this Area
Purchase History
| Date | Buyer | Sale Price | Title Company |
|---|---|---|---|
| Hush Holdings Llc | $204,000 | Stewart Title | |
| Zmk Management Llc | $207,900 | Chicago Title Insurance Co | |
| Clusen Judith A | -- | None Available | |
| Clusen Paul J | -- | First American Title |
Source: Public Records
Mortgage History
| Date | Status | Borrower | Loan Amount |
|---|---|---|---|
| Open | Hush Holdings Llc | $183,600 | |
| Previous Owner | Zmk Management Llc | $195,000 |
Source: Public Records
Tax History Compared to Growth
Tax History
| Year | Tax Paid | Tax Assessment Tax Assessment Total Assessment is a certain percentage of the fair market value that is determined by local assessors to be the total taxable value of land and additions on the property. | Land | Improvement |
|---|---|---|---|---|
| 2024 | $4,323 | $51,260 | $12,650 | $38,610 |
| 2023 | $4,323 | $51,260 | $12,650 | $38,610 |
| 2022 | $4,409 | $51,260 | $12,650 | $38,610 |
| 2021 | $4,381 | $51,260 | $12,650 | $38,610 |
| 2020 | $4,348 | $51,260 | $12,650 | $38,610 |
| 2019 | $4,351 | $51,260 | $12,650 | $38,610 |
| 2018 | $4,372 | $51,260 | $12,650 | $38,610 |
| 2017 | $4,466 | $51,260 | $12,650 | $38,610 |
| 2016 | $4,525 | $51,260 | $12,650 | $38,610 |
| 2015 | $4,535 | $51,260 | $12,650 | $38,610 |
| 2014 | $4,535 | $51,260 | $12,650 | $38,610 |
| 2013 | $4,535 | $51,260 | $12,650 | $38,610 |
Source: Public Records
Map
Nearby Homes
- 25055 S Center St
- 24758 S Tryon St
- 25254 S Fryer St
- 25225 W Saint Elizabeth Dr Unit B32
- 25221 W Saint Elizabeth Dr Unit B33
- 25215 W Saint Elizabeth Dr Unit B34
- 25211 W Saint Elizabeth Dr Unit B35
- 25205 W Saint Elizabeth Dr Unit B36
- 24350 Marble Rd
- 25641 S Oakview Ct
- 25611 S Blackberry Ln
- 25610 S Parkside Dr
- 26020 W Ravine Woods Dr
- Sec8 W Eames St
- 25726 S Blackberry Ln
- 24530 W Bluff Rd
- 25710 S Parkside Dr
- 24415 W Quail Dr
- 25849 W Winding Hollow Dr
- 25930 W Winding Hollow Dr
- 24921 S Sage St
- 24901 S Sage St
- 24925 S Sage St
- 24910 S Willard St
- 25305 W Eames St
- 25305 W Eames St Unit 25305
- 25305 W Eames St
- 24931 S Sage St
- 24920 S Willard St
- 25307 W Eames St
- Lot 7 Eames St
- 25248 W Joliet St
- 24947 S Sage St
- 25251 W Joliet St
- 25233 W Joliet St
- 25364 W Eames St
- 24953 S Sage St
- 25221 W Joliet St
- 25355 W Eames St
- 24963 S Sage St