Estimated Value: $399,000 - $421,309
4
Beds
2
Baths
1,992
Sq Ft
$206/Sq Ft
Est. Value
About This Home
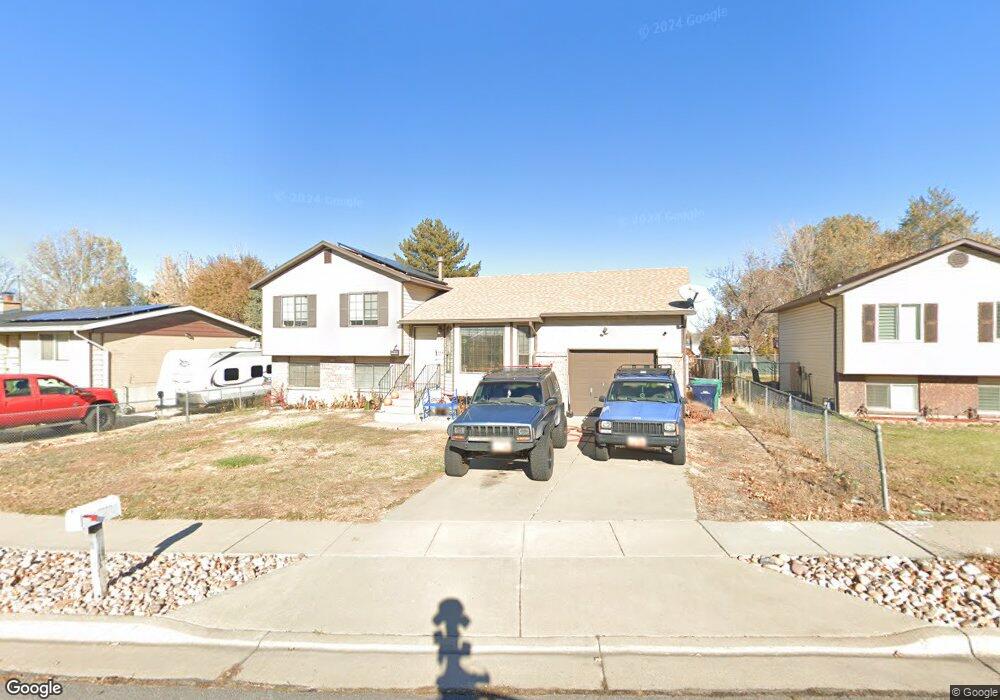
This home is located at 2492 W 6075 S, Roy, UT 84067 and is currently estimated at $409,577, approximately $205 per square foot. 2492 W 6075 S is a home located in Weber County with nearby schools including Municipal School, Roy Junior High School, and Roy High School.
Ownership History
Date
Name
Owned For
Owner Type
Purchase Details
Closed on
Aug 10, 2021
Sold by
Goodrich Matthew Craig and Goodrich Kimberly Joyce
Bought by
Cooper Katrell and Jordan Christopher
Current Estimated Value
Home Financials for this Owner
Home Financials are based on the most recent Mortgage that was taken out on this home.
Original Mortgage
$349,551
Outstanding Balance
$317,850
Interest Rate
2.9%
Mortgage Type
FHA
Estimated Equity
$91,727
Purchase Details
Closed on
Jun 21, 2019
Sold by
Kladden Kelsey
Bought by
Goodrich Matthew Craig and Goodrich Kimberly Joyce
Home Financials for this Owner
Home Financials are based on the most recent Mortgage that was taken out on this home.
Original Mortgage
$263,415
Interest Rate
4.1%
Mortgage Type
VA
Purchase Details
Closed on
Jul 27, 2016
Bought by
Kladden Kelsey
Home Financials for this Owner
Home Financials are based on the most recent Mortgage that was taken out on this home.
Original Mortgage
$188,180
Interest Rate
3.45%
Create a Home Valuation Report for This Property
The Home Valuation Report is an in-depth analysis detailing your home's value as well as a comparison with similar homes in the area
Home Values in the Area
Average Home Value in this Area
Purchase History
| Date | Buyer | Sale Price | Title Company |
|---|---|---|---|
| Cooper Katrell | -- | Rudd Hawkes Title Ins Agcy | |
| Goodrich Matthew Craig | -- | First American Title | |
| Kladden Kelsey | -- | -- |
Source: Public Records
Mortgage History
| Date | Status | Borrower | Loan Amount |
|---|---|---|---|
| Open | Cooper Katrell | $349,551 | |
| Previous Owner | Goodrich Matthew Craig | $263,415 | |
| Previous Owner | Kladden Kelsey | $188,180 | |
| Previous Owner | Kladden Kelsey | -- |
Source: Public Records
Tax History Compared to Growth
Tax History
| Year | Tax Paid | Tax Assessment Tax Assessment Total Assessment is a certain percentage of the fair market value that is determined by local assessors to be the total taxable value of land and additions on the property. | Land | Improvement |
|---|---|---|---|---|
| 2025 | $2,675 | $425,098 | $123,561 | $301,537 |
| 2024 | $2,459 | $215,049 | $67,958 | $147,091 |
| 2023 | $2,363 | $206,800 | $66,744 | $140,056 |
| 2022 | $2,445 | $221,100 | $58,938 | $162,162 |
| 2021 | $1,980 | $293,000 | $76,581 | $216,419 |
| 2020 | $1,835 | $249,000 | $76,581 | $172,419 |
| 2019 | $1,827 | $234,000 | $46,247 | $187,753 |
| 2018 | $1,677 | $201,000 | $41,242 | $159,758 |
| 2017 | $1,612 | $181,000 | $38,262 | $142,738 |
| 2016 | $1,504 | $90,396 | $16,929 | $73,467 |
| 2015 | $1,323 | $80,540 | $16,929 | $63,611 |
| 2014 | $1,232 | $73,349 | $16,929 | $56,420 |
Source: Public Records
Map
Nearby Homes