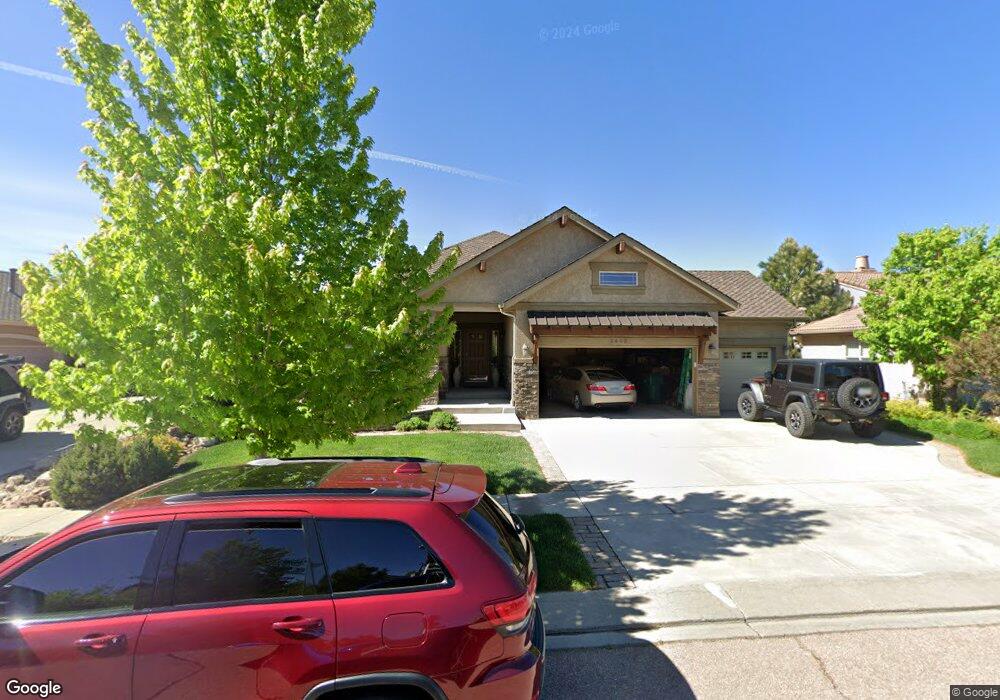
2493 Cinnabar Rd Colorado Springs, CO 80921
Flying Horse Ranch NeighborhoodEstimated Value: $730,312 - $852,000
5
Beds
3
Baths
1,876
Sq Ft
$416/Sq Ft
Est. Value
About This Home
This home is located at 2493 Cinnabar Rd, Colorado Springs, CO 80921 and is currently estimated at $781,328, approximately $416 per square foot. 2493 Cinnabar Rd is a home located in El Paso County with nearby schools including Discovery Canyon Campus Elementary School, Discovery Canyon Campus Middle School, and Discovery Canyon Campus High School.
Ownership History
Date
Name
Owned For
Owner Type
Purchase Details
Closed on
Dec 10, 2020
Sold by
Thornton Cyrus F and Thornton Victoria L
Bought by
Cyrus F Thornton Trust
Current Estimated Value
Purchase Details
Closed on
Jul 19, 2016
Sold by
Sandusky Vicki L
Bought by
Thornton Victoria L and Thornton Cyrus F
Purchase Details
Closed on
Jan 10, 2015
Sold by
Sandusky Vicki L and Thornton Cyrus F
Bought by
Thornton Victoria L and Thornton Cyrus F
Purchase Details
Closed on
Nov 24, 2012
Sold by
Thornton Cyrus F and Sandusks Victoria Vicki L
Bought by
Thornton Cyrus F and Thornton Victoria Vicki
Purchase Details
Closed on
Oct 31, 2008
Sold by
Vantage Homes Corp
Bought by
Thornton Cyrus F and Sandusky Vicki L
Home Financials for this Owner
Home Financials are based on the most recent Mortgage that was taken out on this home.
Original Mortgage
$200,000
Outstanding Balance
$129,652
Interest Rate
5.83%
Mortgage Type
Unknown
Estimated Equity
$651,676
Create a Home Valuation Report for This Property
The Home Valuation Report is an in-depth analysis detailing your home's value as well as a comparison with similar homes in the area
Home Values in the Area
Average Home Value in this Area
Purchase History
| Date | Buyer | Sale Price | Title Company |
|---|---|---|---|
| Cyrus F Thornton Trust | -- | None Available | |
| Thornton Victoria L | -- | None Available | |
| Thornton Victoria L | -- | None Available | |
| Thornton Cyrus F | -- | None Available | |
| Thornton Cyrus F | $420,900 | Land Title Guarantee Company |
Source: Public Records
Mortgage History
| Date | Status | Borrower | Loan Amount |
|---|---|---|---|
| Open | Thornton Cyrus F | $200,000 |
Source: Public Records
Tax History Compared to Growth
Tax History
| Year | Tax Paid | Tax Assessment Tax Assessment Total Assessment is a certain percentage of the fair market value that is determined by local assessors to be the total taxable value of land and additions on the property. | Land | Improvement |
|---|---|---|---|---|
| 2025 | $4,964 | $52,760 | -- | -- |
| 2024 | $4,096 | $48,900 | $9,580 | $39,320 |
| 2022 | $3,182 | $35,440 | $9,040 | $26,400 |
| 2021 | $3,400 | $36,460 | $9,300 | $27,160 |
| 2020 | $3,071 | $32,610 | $9,300 | $23,310 |
| 2019 | $3,907 | $32,610 | $9,300 | $23,310 |
| 2018 | $3,915 | $32,420 | $7,490 | $24,930 |
| 2017 | $4,131 | $32,420 | $7,490 | $24,930 |
| 2016 | $3,835 | $32,140 | $7,240 | $24,900 |
| 2015 | $3,830 | $32,140 | $7,240 | $24,900 |
| 2014 | $3,516 | $29,490 | $7,240 | $22,250 |
Source: Public Records
Map
Nearby Homes
- 2553 Cinnabar Rd
- 2374 Cinnabar Rd
- 2351 Limerick Ct
- 13625 Random Ridge View
- 13525 Random Ridge View
- 13632 Stony Hill Point
- 2180 Rocking Horse Ct
- 13654 Fife Ct
- 13274 Cake Bread Heights
- 13114 Cake Bread Heights
- 14535 Roller Coaster Rd
- 13901 Penfold Dr
- 1818 Redbank Dr
- 13084 Cupcake Heights
- 12988 Cupcake Heights
- 12810 Abert Way
- 12950 Penfold Dr
- Magnolia Plan at Flying Horse - Ranch
- Steamboat Plan at Flying Horse - Two Story
- Palisade 1923 Plan at Flying Horse - Ranch
- 2503 Cinnabar Rd
- 2483 Cinnabar Rd
- 2473 Cinnabar Rd
- 2484 Cinnabar Rd
- 2463 Ledgewood Dr
- 0 Cinnabar Unit 1141655
- 2523 Cinnabar Rd
- 2457 Ledgewood Dr
- 2463 Cinnabar Rd
- 2474 Cinnabar Rd
- 2453 Cinnabar Rd
- 2451 Ledgewood Dr
- 2445 Ledgewood Dr
- 2454 Cinnabar Rd
- 2439 Ledgewood Dr
- 2543 Cinnabar Rd
- 2433 Ledgewood Dr
- 2443 Cinnabar Rd
- 2434 Cinnabar Rd
- 2427 Ledgewood Dr