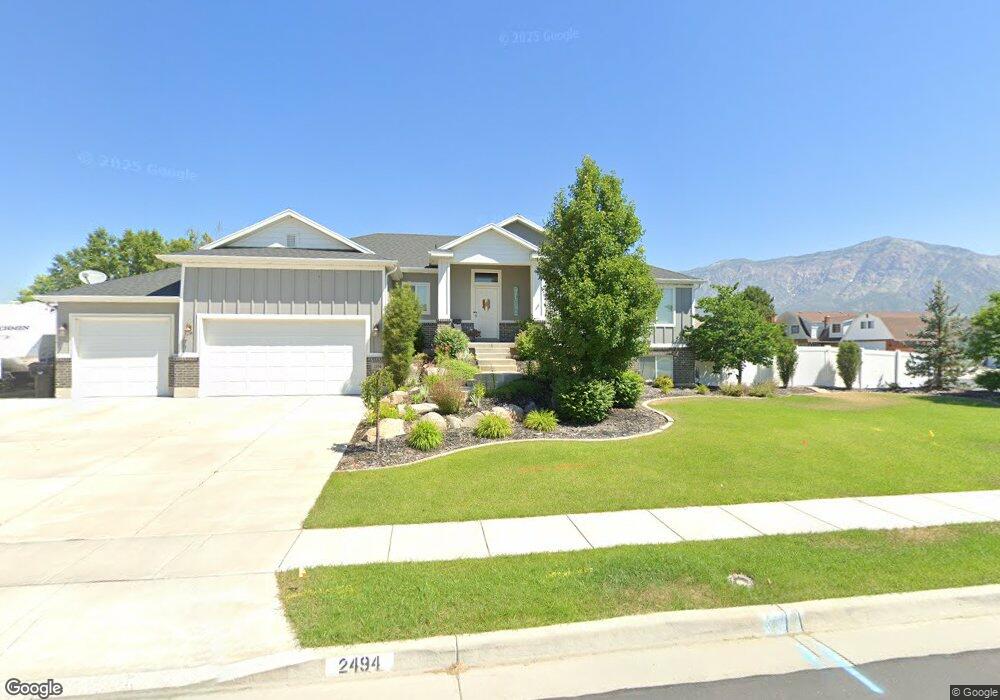
2494 W 2625 N Farr West, UT 84404
Estimated Value: $667,000 - $738,000
6
Beds
3
Baths
3,496
Sq Ft
$201/Sq Ft
Est. Value
About This Home
This home is located at 2494 W 2625 N, Farr West, UT 84404 and is currently estimated at $703,866, approximately $201 per square foot. 2494 W 2625 N is a home located in Weber County with nearby schools including Farr West Elementary School, Wahlquist Junior High School, and Fremont High School.
Ownership History
Date
Name
Owned For
Owner Type
Purchase Details
Closed on
Sep 18, 2020
Sold by
Thurston Debralee and Thurston Ryan A
Bought by
Thurston Ryan A and Thurston Debralee
Current Estimated Value
Home Financials for this Owner
Home Financials are based on the most recent Mortgage that was taken out on this home.
Original Mortgage
$306,000
Outstanding Balance
$271,555
Interest Rate
2.9%
Mortgage Type
New Conventional
Estimated Equity
$432,311
Purchase Details
Closed on
Jan 23, 2017
Sold by
Campbell Cory J
Bought by
Thurston Debralee and Thurston Ryan A
Home Financials for this Owner
Home Financials are based on the most recent Mortgage that was taken out on this home.
Original Mortgage
$320,000
Interest Rate
4.13%
Mortgage Type
New Conventional
Purchase Details
Closed on
Aug 20, 2014
Sold by
Mountain View Title & Escrow Inc
Bought by
Nilson And Company Inc and Nilson Homes
Create a Home Valuation Report for This Property
The Home Valuation Report is an in-depth analysis detailing your home's value as well as a comparison with similar homes in the area
Home Values in the Area
Average Home Value in this Area
Purchase History
| Date | Buyer | Sale Price | Title Company |
|---|---|---|---|
| Thurston Ryan A | -- | Hickman Land Title Layton | |
| Thurston Debralee | -- | Inwest Title | |
| Nilson And Company Inc | -- | Mountain View Title |
Source: Public Records
Mortgage History
| Date | Status | Borrower | Loan Amount |
|---|---|---|---|
| Open | Thurston Ryan A | $306,000 | |
| Closed | Thurston Debralee | $320,000 |
Source: Public Records
Tax History Compared to Growth
Tax History
| Year | Tax Paid | Tax Assessment Tax Assessment Total Assessment is a certain percentage of the fair market value that is determined by local assessors to be the total taxable value of land and additions on the property. | Land | Improvement |
|---|---|---|---|---|
| 2025 | $3,901 | $680,650 | $200,000 | $480,650 |
| 2024 | $3,869 | $377,849 | $109,930 | $267,919 |
| 2023 | $3,633 | $350,900 | $109,728 | $241,172 |
| 2022 | $3,938 | $388,850 | $98,948 | $289,902 |
| 2021 | $3,312 | $552,000 | $104,934 | $447,066 |
| 2020 | $3,091 | $472,000 | $84,940 | $387,060 |
| 2019 | $2,973 | $429,000 | $84,985 | $344,015 |
| 2018 | $3,004 | $415,000 | $84,985 | $330,015 |
| 2017 | $2,746 | $368,000 | $77,966 | $290,034 |
| 2016 | $2,419 | $175,139 | $35,981 | $139,158 |
| 2015 | $918 | $65,420 | $65,420 | $0 |
| 2014 | $865 | $60,174 | $60,174 | $0 |
Source: Public Records
Map
Nearby Homes
- 2540 W 2575 N
- 2405 W 2825 N
- 2442 W 2850 N
- 2477 W 2900 N
- 2440 W 2900 N
- 2427 W 2950 N Unit 100
- 2427 W 2950 N
- 2409 W 2950 N
- 2409 W 2950 N Unit 101
- 2730 N 2775 W Unit 113
- 2705 2825 W Unit 67
- 2485 W 2950 N
- 2519 W 2950 N
- 2938 N 2350 W Unit 105
- 2524 W 2950 N
- 2540 W 2950 N
- 2434 W 2950 N Unit 111
- 2434 W 2950 N
- 2788 W 2775 N Unit 104
- 2414 W 2950 N Unit 110
- 2494 W 2625 N Unit 179
- 2631 N 2450 W Unit 179
- 2645 N 2450 W Unit 180
- 2636 N 2525 W
- 2652 N 2525 W
- 2491 W 2625 N
- 2634 N 2450 W
- 2634 N 2450 W Unit 185
- 2519 W 2625 N
- 2648 N 2450 W
- 2669 N 2450 W
- 2597 N 2450 W
- 2597 N 2450 W Unit 177
- 2527 W 2625 N
- 2532 W 2625 N
- 2664 N 2525 W
- 2649 N 2525 W
- 2672 N 2450 W
- 2443 N 2525 W Unit Lot 93
- 2431 W 2675 N