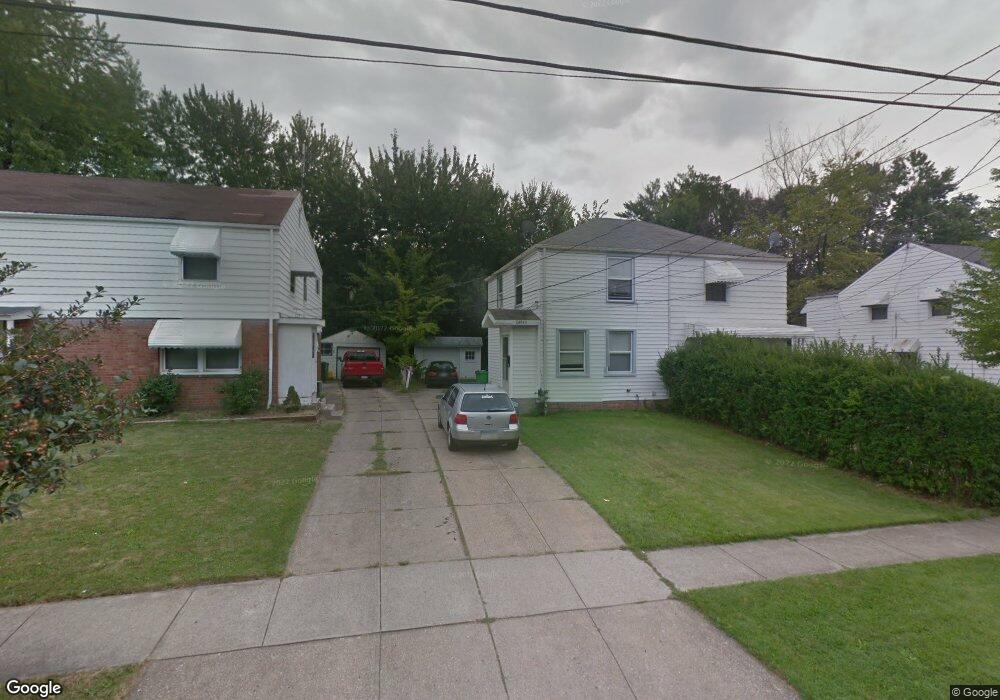
24940 Treadwell Ave Euclid, OH 44117
Estimated Value: $69,348 - $121,000
2
Beds
1
Bath
858
Sq Ft
$105/Sq Ft
Est. Value
About This Home
This home is located at 24940 Treadwell Ave, Euclid, OH 44117 and is currently estimated at $89,837, approximately $104 per square foot. 24940 Treadwell Ave is a home located in Cuyahoga County with nearby schools including Bluestone Elementary School, Euclid Middle School, and Euclid High School.
Ownership History
Date
Name
Owned For
Owner Type
Purchase Details
Closed on
Feb 19, 2005
Sold by
Phillips Bey Kumar B and Phillips Bey Latia E
Bought by
Asante Francis
Current Estimated Value
Home Financials for this Owner
Home Financials are based on the most recent Mortgage that was taken out on this home.
Original Mortgage
$67,467
Outstanding Balance
$34,405
Interest Rate
5.8%
Mortgage Type
FHA
Estimated Equity
$55,432
Purchase Details
Closed on
Jun 16, 1995
Sold by
Cavar Debbie L
Bought by
Cavar Debbie L
Home Financials for this Owner
Home Financials are based on the most recent Mortgage that was taken out on this home.
Original Mortgage
$47,950
Interest Rate
8.27%
Mortgage Type
New Conventional
Purchase Details
Closed on
Jun 20, 1990
Sold by
Sestan Michael
Bought by
Ledford Debbie L
Purchase Details
Closed on
May 25, 1989
Sold by
Tutino Gilbert W
Bought by
Sestan Michael
Purchase Details
Closed on
Jan 1, 1975
Bought by
Tutino Gilbert W
Create a Home Valuation Report for This Property
The Home Valuation Report is an in-depth analysis detailing your home's value as well as a comparison with similar homes in the area
Home Values in the Area
Average Home Value in this Area
Purchase History
| Date | Buyer | Sale Price | Title Company |
|---|---|---|---|
| Asante Francis | $68,000 | Enterprise Title Agency | |
| Cavar Debbie L | $50,500 | -- | |
| Ledford Debbie L | $32,000 | -- | |
| Sestan Michael | $33,000 | -- | |
| Tutino Gilbert W | -- | -- |
Source: Public Records
Mortgage History
| Date | Status | Borrower | Loan Amount |
|---|---|---|---|
| Open | Asante Francis | $67,467 | |
| Previous Owner | Cavar Debbie L | $47,950 |
Source: Public Records
Tax History Compared to Growth
Tax History
| Year | Tax Paid | Tax Assessment Tax Assessment Total Assessment is a certain percentage of the fair market value that is determined by local assessors to be the total taxable value of land and additions on the property. | Land | Improvement |
|---|---|---|---|---|
| 2024 | $1,905 | $26,880 | $4,935 | $21,945 |
| 2023 | $1,586 | $17,610 | $3,780 | $13,830 |
| 2022 | $1,552 | $17,610 | $3,780 | $13,830 |
| 2021 | $1,719 | $17,610 | $3,780 | $13,830 |
| 2020 | $1,453 | $13,340 | $2,870 | $10,470 |
| 2019 | $1,301 | $38,100 | $8,200 | $29,900 |
| 2018 | $1,315 | $13,340 | $2,870 | $10,470 |
| 2017 | $1,420 | $12,110 | $2,380 | $9,730 |
| 2016 | $1,423 | $12,110 | $2,380 | $9,730 |
| 2015 | $1,511 | $12,110 | $2,380 | $9,730 |
| 2014 | $1,511 | $14,250 | $2,800 | $11,450 |
Source: Public Records
Map
Nearby Homes
- 24971 Euclid Ave
- 25151 Euclid Ave
- 24691 Hawthorne Dr
- 1498 E 248th St
- 24690 Hawthorne Dr
- 1467 E 250th St
- 25321 Chatworth Dr
- 1468 E 252nd St
- 1552 E 254th St
- 1530 E 254th St
- 1620 E 243rd St
- 1523 Babbitt Rd
- 1555 E 256th St
- 1471 Hall Ct
- 1836 Braeburn Park Dr
- 1865 Idlehurst Dr
- 1445 Sulzer Ave
- 1823 Sunset Dr
- 1507 E 256th St
- 1790 Skyline Dr
- 24930 Treadwell Ave
- 24950 Treadwell Ave
- 24960 Treadwell Ave
- 24920 Treadwell Ave
- 24970 Treadwell Ave
- 24951 Euclid Ave
- 24980 Treadwell Ave
- 24910 Treadwell Ave
- 24961 Euclid Ave
- 24941 Euclid Ave
- 24931 Treadwell Ave
- 24921 Euclid Ave
- 24981 Euclid Ave
- 25000 Treadwell Ave
- 24991 Euclid Ave
- 1543 E 248th St
- 1581 E 248th St
- 24941 Treadwell Ave
- 25001 Euclid Ave
- 25030 Treadwell Ave