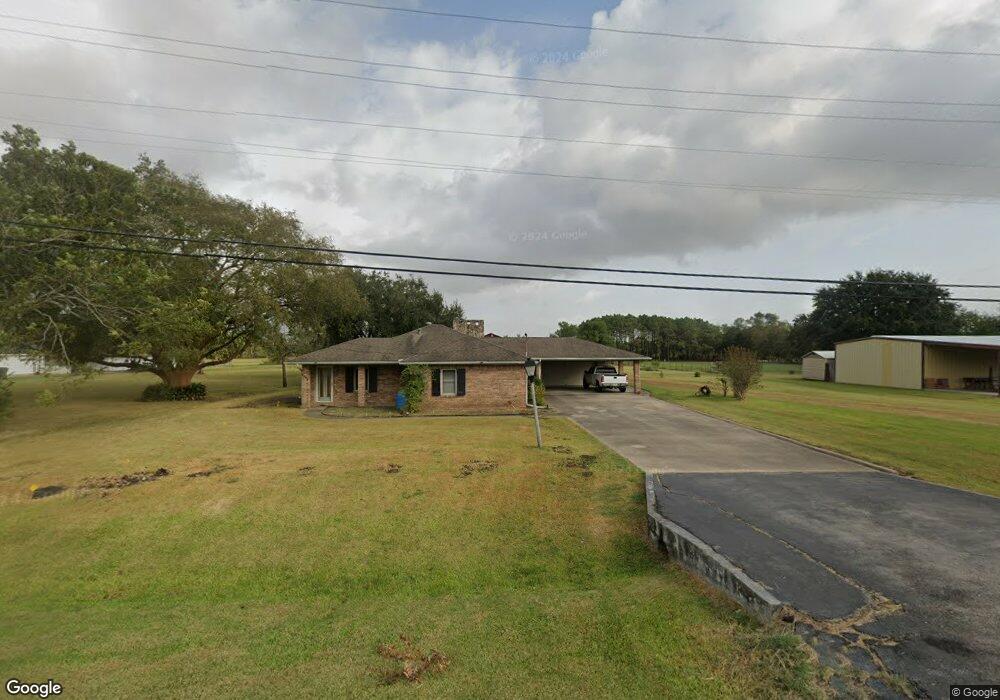
2495 67th St Unit PLUS APARTMENT & 150 Port Arthur, TX 77640
Port Acres NeighborhoodEstimated Value: $206,000 - $301,000
3
Beds
2
Baths
1,780
Sq Ft
$145/Sq Ft
Est. Value
About This Home
This home is located at 2495 67th St Unit PLUS APARTMENT & 150, Port Arthur, TX 77640 and is currently estimated at $258,739, approximately $145 per square foot. 2495 67th St Unit PLUS APARTMENT & 150 is a home located in Jefferson County with nearby schools including Port Acres Elementary School, Abraham Lincoln Middle School, and Memorial High School.
Ownership History
Date
Name
Owned For
Owner Type
Purchase Details
Closed on
Aug 26, 2022
Sold by
Brad Berg
Bought by
Jaime Rovin and Zurita Jose
Current Estimated Value
Home Financials for this Owner
Home Financials are based on the most recent Mortgage that was taken out on this home.
Original Mortgage
$218,500
Outstanding Balance
$209,179
Interest Rate
5.51%
Mortgage Type
New Conventional
Estimated Equity
$49,560
Purchase Details
Closed on
Oct 5, 2021
Sold by
Ernest K Williams Jr Revocable Trust and Williams Ernest K
Bought by
Berg Brad
Purchase Details
Closed on
Nov 20, 2018
Sold by
Simon Florence Joyce
Bought by
Berg Brad and Berg Chelsea
Home Financials for this Owner
Home Financials are based on the most recent Mortgage that was taken out on this home.
Original Mortgage
$242,471
Interest Rate
4.9%
Mortgage Type
FHA
Create a Home Valuation Report for This Property
The Home Valuation Report is an in-depth analysis detailing your home's value as well as a comparison with similar homes in the area
Home Values in the Area
Average Home Value in this Area
Purchase History
| Date | Buyer | Sale Price | Title Company |
|---|---|---|---|
| Jaime Rovin | -- | None Listed On Document | |
| Berg Brad | -- | None Listed On Document | |
| Berg Brad | -- | None Available |
Source: Public Records
Mortgage History
| Date | Status | Borrower | Loan Amount |
|---|---|---|---|
| Open | Jaime Rovin | $218,500 | |
| Previous Owner | Berg Brad | $242,471 |
Source: Public Records
Tax History Compared to Growth
Tax History
| Year | Tax Paid | Tax Assessment Tax Assessment Total Assessment is a certain percentage of the fair market value that is determined by local assessors to be the total taxable value of land and additions on the property. | Land | Improvement |
|---|---|---|---|---|
| 2025 | $5,651 | $300,009 | -- | -- |
| 2024 | $5,651 | $272,735 | $21,706 | $251,029 |
| 2023 | $5,651 | $265,128 | $21,706 | $243,422 |
| 2022 | $6,340 | $199,628 | $0 | $0 |
| 2021 | $6,015 | $198,020 | $21,706 | $176,314 |
| 2020 | $4,501 | $164,982 | $21,706 | $143,276 |
| 2019 | $3,969 | $150,170 | $21,710 | $128,460 |
| 2018 | $4,472 | $140,300 | $21,710 | $118,590 |
| 2017 | $956 | $140,300 | $21,710 | $118,590 |
| 2016 | $3,820 | $130,410 | $21,710 | $108,700 |
| 2015 | $983 | $130,410 | $21,710 | $108,700 |
| 2014 | $983 | $130,410 | $21,710 | $108,700 |
Source: Public Records
Map
Nearby Homes