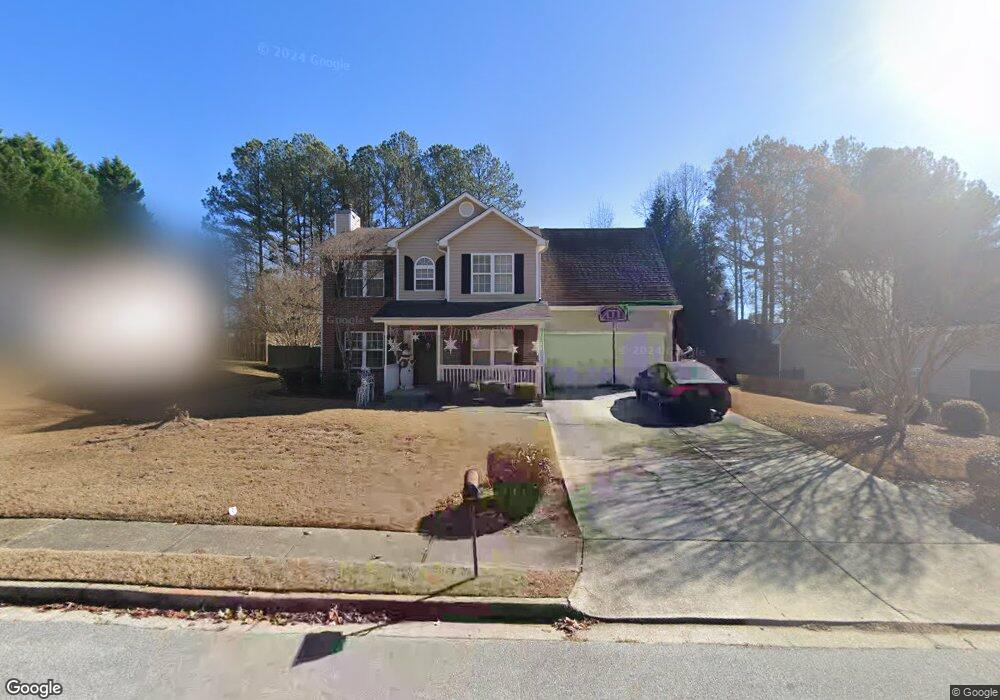
2495 Fort Daniels Dr Unit 3A Dacula, GA 30019
Estimated Value: $361,000 - $378,199
2
Beds
3
Baths
2,035
Sq Ft
$181/Sq Ft
Est. Value
About This Home
This home is located at 2495 Fort Daniels Dr Unit 3A, Dacula, GA 30019 and is currently estimated at $369,050, approximately $181 per square foot. 2495 Fort Daniels Dr Unit 3A is a home located in Gwinnett County with nearby schools including Fort Daniel Elementary School, Frank N. Osborne Middle School, and Mill Creek High School.
Ownership History
Date
Name
Owned For
Owner Type
Purchase Details
Closed on
Jun 14, 2023
Sold by
Balderas Ruth E
Bought by
Balderas Ruth E and Balderas Carlo Alexander
Current Estimated Value
Purchase Details
Closed on
Aug 30, 2006
Sold by
Spires Terrence W and Spires Christina M
Bought by
Balderas Ruth E
Home Financials for this Owner
Home Financials are based on the most recent Mortgage that was taken out on this home.
Original Mortgage
$33,980
Interest Rate
6.67%
Mortgage Type
Unknown
Purchase Details
Closed on
Jan 28, 1999
Sold by
Wendwell Constr Inc
Bought by
Spires Terrence W and Spires Christin
Home Financials for this Owner
Home Financials are based on the most recent Mortgage that was taken out on this home.
Original Mortgage
$119,238
Interest Rate
6.79%
Mortgage Type
FHA
Create a Home Valuation Report for This Property
The Home Valuation Report is an in-depth analysis detailing your home's value as well as a comparison with similar homes in the area
Home Values in the Area
Average Home Value in this Area
Purchase History
| Date | Buyer | Sale Price | Title Company |
|---|---|---|---|
| Balderas Ruth E | -- | -- | |
| Balderas Ruth E | $169,900 | -- | |
| Spires Terrence W | $119,300 | -- |
Source: Public Records
Mortgage History
| Date | Status | Borrower | Loan Amount |
|---|---|---|---|
| Previous Owner | Balderas Ruth E | $33,980 | |
| Previous Owner | Balderas Ruth E | $135,920 | |
| Previous Owner | Spires Terrence W | $119,238 |
Source: Public Records
Tax History Compared to Growth
Tax History
| Year | Tax Paid | Tax Assessment Tax Assessment Total Assessment is a certain percentage of the fair market value that is determined by local assessors to be the total taxable value of land and additions on the property. | Land | Improvement |
|---|---|---|---|---|
| 2025 | $5,900 | $157,640 | $36,080 | $121,560 |
| 2024 | $5,584 | $146,960 | $29,600 | $117,360 |
| 2023 | $5,584 | $139,840 | $29,600 | $110,240 |
| 2022 | $4,816 | $126,240 | $24,800 | $101,440 |
| 2021 | $3,842 | $97,400 | $18,640 | $78,760 |
| 2020 | $3,388 | $84,320 | $17,120 | $67,200 |
| 2019 | $3,264 | $84,320 | $17,120 | $67,200 |
| 2018 | $2,548 | $79,600 | $15,600 | $64,000 |
| 2016 | $2,377 | $70,680 | $12,400 | $58,280 |
| 2015 | $2,236 | $63,400 | $10,400 | $53,000 |
| 2014 | $2,100 | $56,720 | $10,400 | $46,320 |
Source: Public Records
Map
Nearby Homes
- 2425 Fort Daniels Dr Unit 3A
- 1603 Fort Perry Way
- 1720 Fort Daniels Trail
- 1655 Brisbane Dr
- 2416 Moultrie Ct
- 2431 Lance Ridge Way
- 1827 Scouts Walk
- 2706 Captain Ct
- 2439 Canter Brook Ct Unit 1
- 2765 Daniel Park Run Unit 3
- 2032 Shin Ct NE
- 1717 Willoughby Dr
- 1573 Vinings Ct
- 1618 Rocky Knoll Ln
- 2628 Adair Trail
- 2687 High Creek Run
- 2585 Braselton Hwy
- 2674 Rocky Knoll Ct
- 2505 Fort Daniels Dr
- 2485 Fort Daniels Dr
- 1708 Fort Connors Way
- 1718 Fort Connors Way
- 2475 Fort Daniels Dr
- 1698 Fort Connors Way
- 1698 Fort Connors Way Unit 3B
- 2480 Fort Daniels Dr
- 2455 Fort Daniels Dr
- 1717 Fort Connors Way
- 2470 Fort Daniels Dr
- 2470 Fort Daniels Dr Unit 3
- 2510 Fort Daniels Dr
- 1688 Fort Connors Way Unit 3B
- 2445 Fort Daniels Dr
- 2525 Fort Daniels Dr Unit 3A
- 1687 Fort Connors Way
- 2460 Fort Daniels Dr
- 1794 Fort River Way Unit 3B
- 2520 Fort Daniels Dr Unit 3