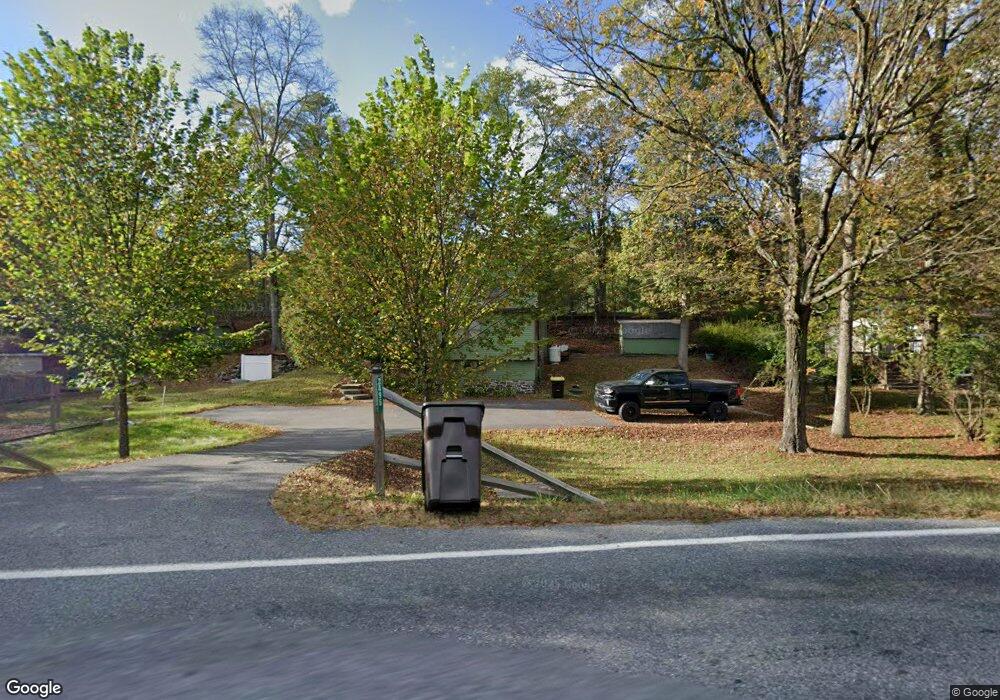
2495 Wigwam Park Rd East Stroudsburg, PA 18301
Estimated Value: $190,000 - $315,000
2
Beds
2
Baths
1,008
Sq Ft
$232/Sq Ft
Est. Value
About This Home
This home is located at 2495 Wigwam Park Rd, East Stroudsburg, PA 18301 and is currently estimated at $233,837, approximately $231 per square foot. 2495 Wigwam Park Rd is a home located in Monroe County with nearby schools including Stroudsburg Junior High School, Stroudsburg High School, and Stroudsburg Seventh-day Adventist School.
Ownership History
Date
Name
Owned For
Owner Type
Purchase Details
Closed on
Sep 12, 2021
Sold by
Scalingi Denise M and Dailey Denise M
Bought by
Savino & Sons Llc
Current Estimated Value
Purchase Details
Closed on
Sep 30, 2016
Sold by
Scalingi Robert V
Bought by
Scalingi Denise M
Home Financials for this Owner
Home Financials are based on the most recent Mortgage that was taken out on this home.
Original Mortgage
$64,000
Interest Rate
3.46%
Mortgage Type
New Conventional
Purchase Details
Closed on
Jul 28, 2016
Sold by
Scalingi Denise
Bought by
Scalingi Robert V
Purchase Details
Closed on
Apr 23, 2016
Sold by
Scalingi Robert V
Bought by
Scalingi Denise
Purchase Details
Closed on
Dec 27, 2002
Bought by
Scalingi Robert
Create a Home Valuation Report for This Property
The Home Valuation Report is an in-depth analysis detailing your home's value as well as a comparison with similar homes in the area
Home Values in the Area
Average Home Value in this Area
Purchase History
| Date | Buyer | Sale Price | Title Company |
|---|---|---|---|
| Savino & Sons Llc | $125,000 | Gateway Abstract | |
| Scalingi Denise M | $80,000 | None Available | |
| Scalingi Robert V | -- | Attorney | |
| Scalingi Denise | -- | Attorney | |
| Scalingi Robert | $85,900 | -- |
Source: Public Records
Mortgage History
| Date | Status | Borrower | Loan Amount |
|---|---|---|---|
| Previous Owner | Scalingi Denise M | $64,000 |
Source: Public Records
Tax History Compared to Growth
Tax History
| Year | Tax Paid | Tax Assessment Tax Assessment Total Assessment is a certain percentage of the fair market value that is determined by local assessors to be the total taxable value of land and additions on the property. | Land | Improvement |
|---|---|---|---|---|
| 2025 | $697 | $86,220 | $20,400 | $65,820 |
| 2024 | $570 | $86,220 | $20,400 | $65,820 |
| 2023 | $2,878 | $86,220 | $20,400 | $65,820 |
| 2022 | $2,939 | $86,220 | $20,400 | $65,820 |
| 2021 | $2,848 | $86,220 | $20,400 | $65,820 |
| 2020 | $2,428 | $86,220 | $20,400 | $65,820 |
| 2019 | $2,063 | $10,940 | $2,720 | $8,220 |
| 2018 | $2,201 | $10,940 | $2,720 | $8,220 |
| 2017 | $2,201 | $10,940 | $2,720 | $8,220 |
| 2016 | $414 | $10,940 | $2,720 | $8,220 |
| 2015 | -- | $10,940 | $2,720 | $8,220 |
| 2014 | -- | $10,940 | $2,720 | $8,220 |
Source: Public Records
Map
Nearby Homes
- 476 Hyland Dr
- 445 Hyland Dr
- 6284 Cardinal Dr
- 1117 Belaire Dr
- 4104 Ashwood Ln
- 1808 Jennifer Dr
- 3114 Fairfax Terrace
- 0 Wigwam Park Rd
- 329 Hyland Dr
- 317 Robinwood Terrace
- 7109 Pine Grove
- 1212 Brentwood Dr
- 348 Clicko Ln
- 0 Marshall Dr
- 916 Mt Zion Ave
- 453 Lakeside Dr
- 5104 Lake Dr
- 249 Estates Drive (Lot 21)
- 6128 Wales Ct
- 511 Lakeside Dr
- 2505 Wigwam Park Rd
- 3239 RR 3 Lr 45019 Wigwan Park Rd
- 2490 Wigwam Park Rd
- 7113 Wisteria Ct
- 30 Willow Pond Ct
- 32 Willow Pond Ct
- 7117 Wisteria Ct
- 34 Willow Pond Ct
- 7105 Wisteria Ct
- 7121 Wisteria Ct
- 36 Willow Pond Ct
- 2 Willow Pond Dr
- 31 Willow Pond Ct
- 31 Willow Pond Ct
- 7112 Wisteria Ct
- 7118 Wisteria Ct
- 7120 Wisteria Ct
- 4 Willow Pond Dr
- 5124 Meadowlark Ln
- 7120 Wisteria Ct