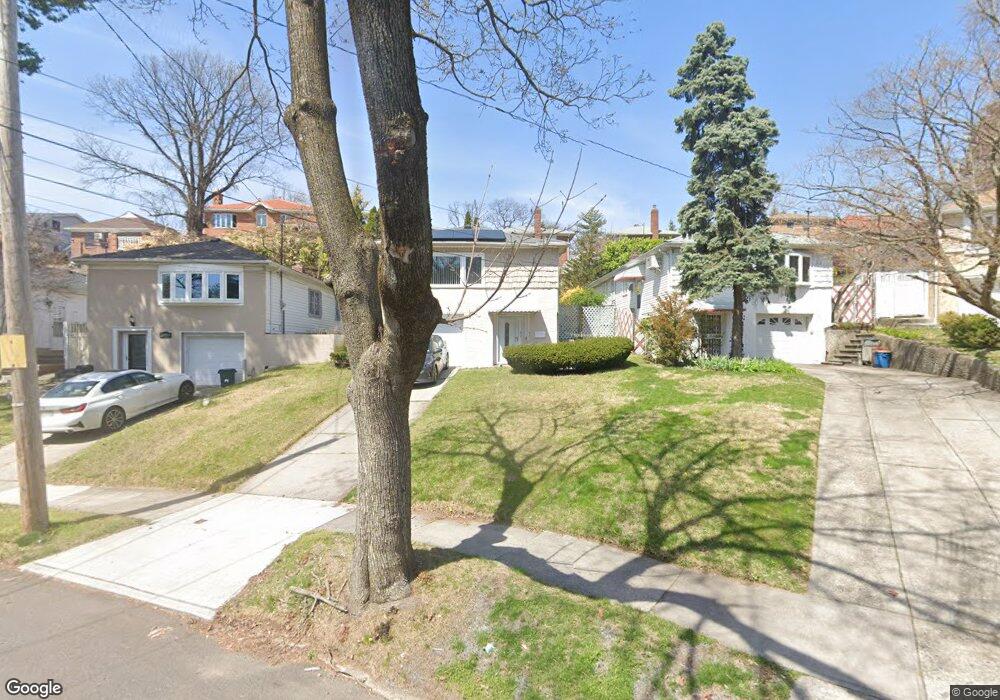
24955 Thebes Ave Little Neck, NY 11362
Little Neck NeighborhoodEstimated Value: $1,012,000 - $1,224,000
--
Bed
--
Bath
1,732
Sq Ft
$644/Sq Ft
Est. Value
About This Home
This home is located at 24955 Thebes Ave, Little Neck, NY 11362 and is currently estimated at $1,115,194, approximately $643 per square foot. 24955 Thebes Ave is a home located in Queens County with nearby schools including P.S. 94 - David D. Porter, Louis Pasteur Middle School 67, and Benjamin N Cardozo High School.
Ownership History
Date
Name
Owned For
Owner Type
Purchase Details
Closed on
Jan 19, 2021
Sold by
Gold Bayside Llc and Metropolitan Associates Lp
Bought by
Sohn Kyung Jin
Current Estimated Value
Purchase Details
Closed on
Oct 23, 2020
Sold by
Sohn Kyung Jin
Bought by
Cho Jacob and Cho Jennifer
Home Financials for this Owner
Home Financials are based on the most recent Mortgage that was taken out on this home.
Original Mortgage
$731,110
Interest Rate
2.9%
Mortgage Type
New Conventional
Purchase Details
Closed on
Nov 13, 2007
Sold by
Kim Jong Hoo
Bought by
Sohn Kyung Jin
Home Financials for this Owner
Home Financials are based on the most recent Mortgage that was taken out on this home.
Original Mortgage
$100,000
Interest Rate
6.48%
Purchase Details
Closed on
Jul 6, 2006
Sold by
Christ Margaret and John E Loughlin As Guardian
Bought by
Kim Jong Hoo
Home Financials for this Owner
Home Financials are based on the most recent Mortgage that was taken out on this home.
Original Mortgage
$549,000
Interest Rate
6.67%
Mortgage Type
Purchase Money Mortgage
Create a Home Valuation Report for This Property
The Home Valuation Report is an in-depth analysis detailing your home's value as well as a comparison with similar homes in the area
Home Values in the Area
Average Home Value in this Area
Purchase History
| Date | Buyer | Sale Price | Title Company |
|---|---|---|---|
| Sohn Kyung Jin | $370,000 | -- | |
| Cho Jacob | $913,888 | -- | |
| Sohn Kyung Jin | $682,000 | -- | |
| Sohn Kyung Jin | $682,000 | -- | |
| Kim Jong Hoo | $610,000 | -- | |
| Kim Jong Hoo | $610,000 | -- |
Source: Public Records
Mortgage History
| Date | Status | Borrower | Loan Amount |
|---|---|---|---|
| Previous Owner | Cho Jacob | $731,110 | |
| Previous Owner | Sohn Kyung Jin | $100,000 | |
| Previous Owner | Sohn Kyung Jin | $250,000 | |
| Previous Owner | Kim Jong Hoo | $549,000 |
Source: Public Records
Tax History Compared to Growth
Tax History
| Year | Tax Paid | Tax Assessment Tax Assessment Total Assessment is a certain percentage of the fair market value that is determined by local assessors to be the total taxable value of land and additions on the property. | Land | Improvement |
|---|---|---|---|---|
| 2025 | $9,577 | $50,544 | $9,186 | $41,358 |
| 2024 | $7,757 | $47,683 | $8,387 | $39,296 |
| 2023 | $9,036 | $44,988 | $8,655 | $36,333 |
| 2022 | $8,981 | $61,920 | $11,820 | $50,100 |
| 2021 | $9,396 | $66,240 | $11,820 | $54,420 |
| 2020 | $8,916 | $65,520 | $11,820 | $53,700 |
| 2019 | $8,312 | $59,520 | $11,820 | $47,700 |
| 2018 | $7,642 | $37,490 | $8,134 | $29,356 |
| 2017 | $7,642 | $37,490 | $8,188 | $29,302 |
| 2016 | $7,437 | $37,490 | $8,188 | $29,302 |
| 2015 | $4,266 | $35,100 | $10,950 | $24,150 |
| 2014 | $4,266 | $33,114 | $10,728 | $22,386 |
Source: Public Records
Map
Nearby Homes
- 50-54 Deepdale Place
- 24947 Rushmore Terrace
- 51-27 Browvale Ln
- 50-43 Morenci Ln
- 252-25 Leith Rd
- 24854 Thebes Ave
- 4529 Marathon Pkwy
- 25271 Brattle Ave
- 249-14 Cambria Ave
- 4817 Little Neck Pkwy
- 5006 Marathon Pkwy
- 4934 Little Neck Pkwy
- 45-26 Zion St
- 51-10 Little Neck Pkwy
- 4806 Glenwood St
- 47-27 Little Neck Pkwy Unit 4G
- 4521 248th St
- 47-44 Glenwood St
- 249-35 51st Ave
- 4734 Glenwood St
- 249-55 Thebes Ave Unit 1
- 249-55 Thebes Ave
- 24959 Thebes Ave
- 24951 Thebes Ave
- 24947 Thebes Ave
- 249-47 Thebes Ave
- 24963 Thebes Ave
- 249-63 Thebes Ave
- 24956 Beechknoll Ave
- 24960 Beechknoll Ave
- 24956 Beechknoll Ave
- 24943 Thebes Ave
- 24943 Thebes Ave
- 249-60 Beechknoll Ave
- 24950 Beechknoll Ave
- 24964 Beechknoll Ave
- 24964 Beechknoll Ave
- 249-44 Beechknoll Ave
- 24970 Beechknoll Ave
- 50-34 Thebes Ave