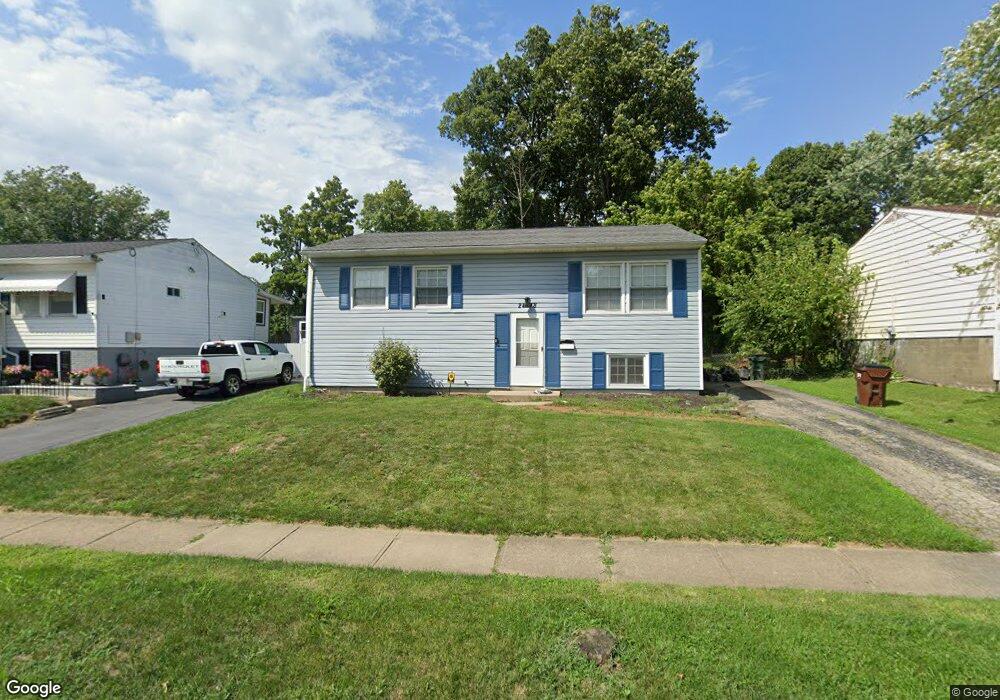
2498 Berthbrook Dr Cincinnati, OH 45231
New Burlington NeighborhoodEstimated Value: $187,980 - $210,000
4
Beds
2
Baths
1,336
Sq Ft
$150/Sq Ft
Est. Value
About This Home
This home is located at 2498 Berthbrook Dr, Cincinnati, OH 45231 and is currently estimated at $200,245, approximately $149 per square foot. 2498 Berthbrook Dr is a home located in Hamilton County with nearby schools including Mt Healthy High School, Hamilton County Mathematics and Science Academy, and Central Montessori Academy.
Ownership History
Date
Name
Owned For
Owner Type
Purchase Details
Closed on
Aug 2, 2006
Sold by
Home Solutions Llc
Bought by
Thompson Ernestine
Current Estimated Value
Home Financials for this Owner
Home Financials are based on the most recent Mortgage that was taken out on this home.
Original Mortgage
$94,500
Interest Rate
6.16%
Mortgage Type
Purchase Money Mortgage
Purchase Details
Closed on
May 11, 2006
Sold by
Hagedorn Joseph C and Hagedorn Amy M
Bought by
Home Solutions Llc
Purchase Details
Closed on
Apr 20, 2006
Sold by
Hud
Bought by
Hagedorn Joseph C
Purchase Details
Closed on
Sep 2, 2005
Sold by
Farley Brian L and Engel Heather S
Bought by
Hud
Purchase Details
Closed on
Aug 25, 1999
Sold by
Michael Fugate Glen and Michael Catherine B
Bought by
Farley Brian L and Engel Heather S
Home Financials for this Owner
Home Financials are based on the most recent Mortgage that was taken out on this home.
Original Mortgage
$88,272
Interest Rate
7.61%
Mortgage Type
FHA
Purchase Details
Closed on
Dec 3, 1998
Sold by
Fugate Glen Michael
Bought by
Fugate Glen Michael and Fugate Catherine B
Create a Home Valuation Report for This Property
The Home Valuation Report is an in-depth analysis detailing your home's value as well as a comparison with similar homes in the area
Home Values in the Area
Average Home Value in this Area
Purchase History
| Date | Buyer | Sale Price | Title Company |
|---|---|---|---|
| Thompson Ernestine | $105,000 | First Assurance Title Agency | |
| Home Solutions Llc | -- | None Available | |
| Hagedorn Joseph C | $70,250 | Lakeside Title & Escrow Agen | |
| Hud | $54,000 | None Available | |
| Farley Brian L | $89,000 | Performance Title Agency Inc | |
| Fugate Glen Michael | -- | -- |
Source: Public Records
Mortgage History
| Date | Status | Borrower | Loan Amount |
|---|---|---|---|
| Previous Owner | Thompson Ernestine | $94,500 | |
| Previous Owner | Farley Brian L | $88,272 |
Source: Public Records
Tax History
| Year | Tax Paid | Tax Assessment Tax Assessment Total Assessment is a certain percentage of the fair market value that is determined by local assessors to be the total taxable value of land and additions on the property. | Land | Improvement |
|---|---|---|---|---|
| 2025 | $2,628 | $47,800 | $7,088 | $40,712 |
| 2023 | $2,519 | $47,800 | $7,088 | $40,712 |
| 2022 | $2,077 | $28,637 | $6,468 | $22,169 |
| 2021 | $2,067 | $28,637 | $6,468 | $22,169 |
| 2020 | $2,038 | $28,637 | $6,468 | $22,169 |
| 2019 | $1,887 | $24,269 | $5,481 | $18,788 |
| 2018 | $1,897 | $24,269 | $5,481 | $18,788 |
| 2017 | $1,824 | $24,269 | $5,481 | $18,788 |
| 2016 | $1,783 | $23,216 | $6,955 | $16,261 |
| 2015 | $1,767 | $23,216 | $6,955 | $16,261 |
| 2014 | $1,755 | $23,216 | $6,955 | $16,261 |
| 2013 | $1,834 | $25,235 | $7,560 | $17,675 |
Source: Public Records
Map
Nearby Homes
- 9846 Pinedale Dr
- 9925 Grasscreek Ct
- 2792 Wheatfield Dr
- 10073 Pippin Rd
- 10061 Sturgeon Ln
- 2610 Niagara St
- 2752 Mancelona Ct
- 9632 Sacramento St
- 9500 Ridgemoor Ave
- 2317 Magdalena Dr
- 2005 Miles Rd
- 3013 Niagara St
- 2773 Grosvenor Dr
- 3099 Niagara St
- 2585 Fulbourne Dr
- 9391 Jericho Dr
- 2329 Garrison Dr
- 2908 Libra Ln
- 9287 Coogan Dr
- 9577 Creekhill Dr
- 2490 Berthbrook Dr
- 2510 Berthbrook Dr
- 9998 Greenriver Dr
- 2518 Berthbrook Dr
- 2478 Berthbrook Dr
- 2503 Berthbrook Dr
- 9994 Greenriver Dr
- 9999 Greenriver Dr
- 2530 Berthbrook Dr
- 2470 Berthbrook Dr
- 2491 Berthbrook Dr
- 1 Berthbrook Dr
- 9908 Norcrest Dr
- 2479 Berthbrook Dr
- 9913 Norcrest Dr
- 2458 Berthbrook Dr
- 2538 Berthbrook Dr
- 9990 Greenriver Dr
- 2471 Berthbrook Dr
- 9995 Greenriver Dr
Your Personal Tour Guide
Ask me questions while you tour the home.