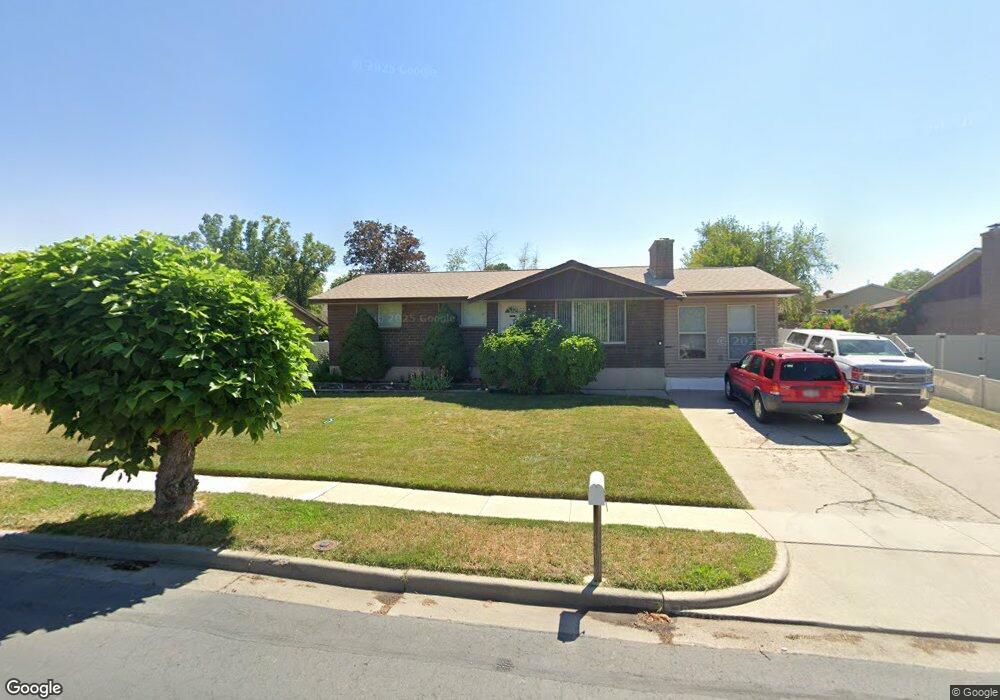
2499 Blake Dr Salt Lake City, UT 84129
Estimated Value: $493,896 - $561,000
3
Beds
2
Baths
1,328
Sq Ft
$404/Sq Ft
Est. Value
About This Home
This home is located at 2499 Blake Dr, Salt Lake City, UT 84129 and is currently estimated at $536,724, approximately $404 per square foot. 2499 Blake Dr is a home located in Salt Lake County with nearby schools including Calvin S Smith Elementary School, Bennion Junior High School, and Taylorsville High School.
Ownership History
Date
Name
Owned For
Owner Type
Purchase Details
Closed on
Mar 20, 2023
Sold by
Daniels Terry R
Bought by
Daniels Telina T and Daniels Terry R
Current Estimated Value
Home Financials for this Owner
Home Financials are based on the most recent Mortgage that was taken out on this home.
Original Mortgage
$100,600
Outstanding Balance
$88,719
Interest Rate
5.14%
Mortgage Type
New Conventional
Estimated Equity
$448,005
Purchase Details
Closed on
May 26, 1997
Sold by
Daniels Terry R
Bought by
Daniels Terry R and Daniels Telina T
Home Financials for this Owner
Home Financials are based on the most recent Mortgage that was taken out on this home.
Original Mortgage
$40,000
Interest Rate
7.67%
Purchase Details
Closed on
May 12, 1994
Sold by
Bradshaw Jimmy T N and Bradshaw Gloria Ann
Bought by
Daniels Terry R
Home Financials for this Owner
Home Financials are based on the most recent Mortgage that was taken out on this home.
Original Mortgage
$98,800
Interest Rate
8.1%
Mortgage Type
FHA
Create a Home Valuation Report for This Property
The Home Valuation Report is an in-depth analysis detailing your home's value as well as a comparison with similar homes in the area
Home Values in the Area
Average Home Value in this Area
Purchase History
| Date | Buyer | Sale Price | Title Company |
|---|---|---|---|
| Daniels Telina T | -- | Advanced Title | |
| Daniels Terry R | -- | First American Title | |
| Daniels Terry R | -- | First American Title |
Source: Public Records
Mortgage History
| Date | Status | Borrower | Loan Amount |
|---|---|---|---|
| Open | Daniels Telina T | $100,600 | |
| Previous Owner | Daniels Terry R | $40,000 | |
| Previous Owner | Daniels Terry R | $98,800 |
Source: Public Records
Tax History Compared to Growth
Tax History
| Year | Tax Paid | Tax Assessment Tax Assessment Total Assessment is a certain percentage of the fair market value that is determined by local assessors to be the total taxable value of land and additions on the property. | Land | Improvement |
|---|---|---|---|---|
| 2025 | $2,875 | $493,800 | $144,500 | $349,300 |
| 2024 | $2,875 | $471,400 | $137,500 | $333,900 |
| 2023 | $2,624 | $422,100 | $132,200 | $289,900 |
| 2022 | $2,492 | $425,200 | $129,600 | $295,600 |
| 2021 | $2,102 | $318,000 | $99,700 | $218,300 |
| 2020 | $1,964 | $283,600 | $99,700 | $183,900 |
| 2019 | $1,889 | $267,600 | $92,800 | $174,800 |
| 2018 | $1,856 | $254,600 | $92,800 | $161,800 |
| 2017 | $1,639 | $237,800 | $92,800 | $145,000 |
| 2016 | $1,243 | $185,300 | $92,800 | $92,500 |
| 2015 | $1,395 | $193,300 | $95,800 | $97,500 |
| 2014 | $1,354 | $185,300 | $92,700 | $92,600 |
Source: Public Records
Map
Nearby Homes
- 5668 Lolene Way
- 1891 S Jordan Canal Rd
- 2503 5520 S
- 5574 Easton St
- 5725 S 2665 W
- 2579 W 5780 S
- 2266 W Arches Dr
- 5600 S Ralph Dr
- 5557 S 2200 W
- 5597 S Bastile Dr
- 2320 W 5400 S
- 2794 W Harker Ridge Cove
- 2337 Sharron Dr
- 2127 Cedar Breaks Dr
- 2322 W Surrey Rd
- 3002 Carranza Dr
- 2001 W 5540 S
- 5539 S Danube Dr
- 5552 Hew Wood Dr
- 6016 S Paprika Cir