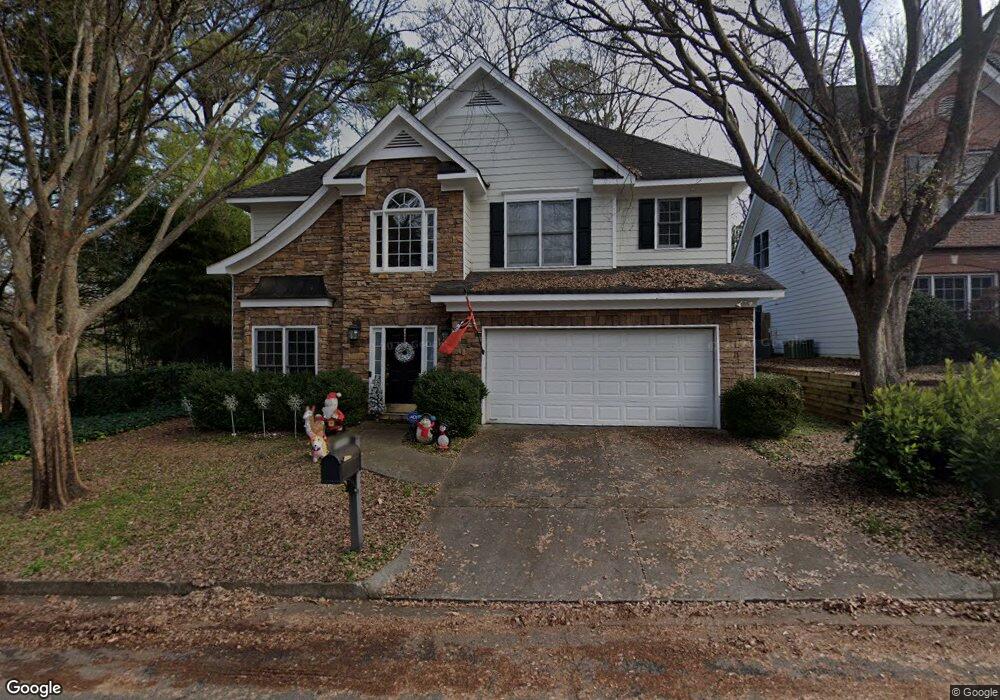
2499 Emerald Ridge Ct NE Atlanta, GA 30345
Estimated Value: $523,000 - $607,000
3
Beds
3
Baths
2,063
Sq Ft
$273/Sq Ft
Est. Value
About This Home
This home is located at 2499 Emerald Ridge Ct NE, Atlanta, GA 30345 and is currently estimated at $564,051, approximately $273 per square foot. 2499 Emerald Ridge Ct NE is a home located in DeKalb County with nearby schools including John Robert Lewis Elementary School, Sequoyah Middle School, and Cross Keys High School.
Ownership History
Date
Name
Owned For
Owner Type
Purchase Details
Closed on
Dec 27, 2011
Sold by
The Bank Of New York Mello
Bought by
Mulkey Natalie
Current Estimated Value
Home Financials for this Owner
Home Financials are based on the most recent Mortgage that was taken out on this home.
Original Mortgage
$196,849
Outstanding Balance
$132,966
Interest Rate
3.75%
Mortgage Type
FHA
Estimated Equity
$431,085
Purchase Details
Closed on
Jun 7, 2011
Sold by
Gallant David
Bought by
Bank Of Ny Mellon Series 2006-
Purchase Details
Closed on
Oct 20, 2005
Sold by
Kalantari Laireza
Bought by
Gallant David
Home Financials for this Owner
Home Financials are based on the most recent Mortgage that was taken out on this home.
Original Mortgage
$58,780
Interest Rate
5.76%
Mortgage Type
Stand Alone Refi Refinance Of Original Loan
Purchase Details
Closed on
Jan 7, 2005
Sold by
Reloaction
Bought by
Kalantari Alireza
Create a Home Valuation Report for This Property
The Home Valuation Report is an in-depth analysis detailing your home's value as well as a comparison with similar homes in the area
Home Values in the Area
Average Home Value in this Area
Purchase History
| Date | Buyer | Sale Price | Title Company |
|---|---|---|---|
| Mulkey Natalie | $202,000 | -- | |
| Bank Of Ny Mellon Series 2006- | $238,500 | -- | |
| Gallant David | $293,900 | -- | |
| Kalantari Alireza | $240,000 | -- | |
| Relocation | $240,000 | -- |
Source: Public Records
Mortgage History
| Date | Status | Borrower | Loan Amount |
|---|---|---|---|
| Open | Mulkey Natalie | $196,849 | |
| Previous Owner | Gallant David | $58,780 |
Source: Public Records
Tax History Compared to Growth
Tax History
| Year | Tax Paid | Tax Assessment Tax Assessment Total Assessment is a certain percentage of the fair market value that is determined by local assessors to be the total taxable value of land and additions on the property. | Land | Improvement |
|---|---|---|---|---|
| 2025 | $6,292 | $207,200 | $39,600 | $167,600 |
| 2024 | $5,909 | $196,720 | $39,600 | $157,120 |
| 2023 | $5,909 | $178,560 | $39,600 | $138,960 |
| 2022 | $5,385 | $176,400 | $39,600 | $136,800 |
| 2021 | $4,569 | $152,240 | $39,600 | $112,640 |
| 2020 | $4,996 | $163,840 | $39,600 | $124,240 |
| 2019 | $4,517 | $145,240 | $39,600 | $105,640 |
| 2018 | $4,358 | $147,960 | $34,280 | $113,680 |
| 2017 | $4,507 | $128,040 | $34,280 | $93,760 |
| 2016 | $4,282 | $124,160 | $34,280 | $89,880 |
| 2014 | $2,789 | $80,800 | $34,360 | $46,440 |
Source: Public Records
Map
Nearby Homes
- 2002 Variations Dr NE
- 2007 Variations Dr NE
- 2286 Capehart Cir NE
- 2360 Johnson Rd NE
- 1932 Variations Dr NE
- 2072 Clairmont Terrace NE
- 1929 Variations Dr NE
- 2372 Johnson Rd NE
- 2080 Clairmont Terrace NE
- 1924 Variations Dr NE
- 1906 Variations Dr NE
- 2099 Clairmont Terrace NE
- 1931 Gregory Run NE
- 1899 Raven Hill Dr NE
- 1956 Skyfall Cir NE
- 1892 Skyfall Cir NE
- 2431 Skyland Way NE
- 2601 Stoland Dr NE
- 2491 Emerald Ridge Ct NE
- 0 Emerald Ridge Ct NE Unit 7524125
- 0 Emerald Ridge Ct NE Unit 7448201
- 0 Emerald Ridge Ct NE Unit 3210405
- 0 Emerald Ridge Ct NE Unit 8847452
- 0 Emerald Ridge Ct NE Unit 8144514
- 0 Emerald Ridge Ct NE Unit 3107269
- 0 Emerald Ridge Ct NE Unit 3137760
- 0 Emerald Ridge Ct NE
- 2485 Emerald Ridge Ct NE
- 2500 Emerald Ridge Ct NE
- 2494 Emerald Ridge Ct NE
- 2488 Emerald Ridge Ct NE
- 2084 Dering Cir NE
- 2479 Emerald Ridge Ct NE
- 2484 Emerald Ridge Ct NE
- 2495 Rosecrest Place NE
- 2489 Rosecrest Place NE Unit 2
- 2489 Rosecrest Place NE Unit None
- 2489 Rosecrest Place NE