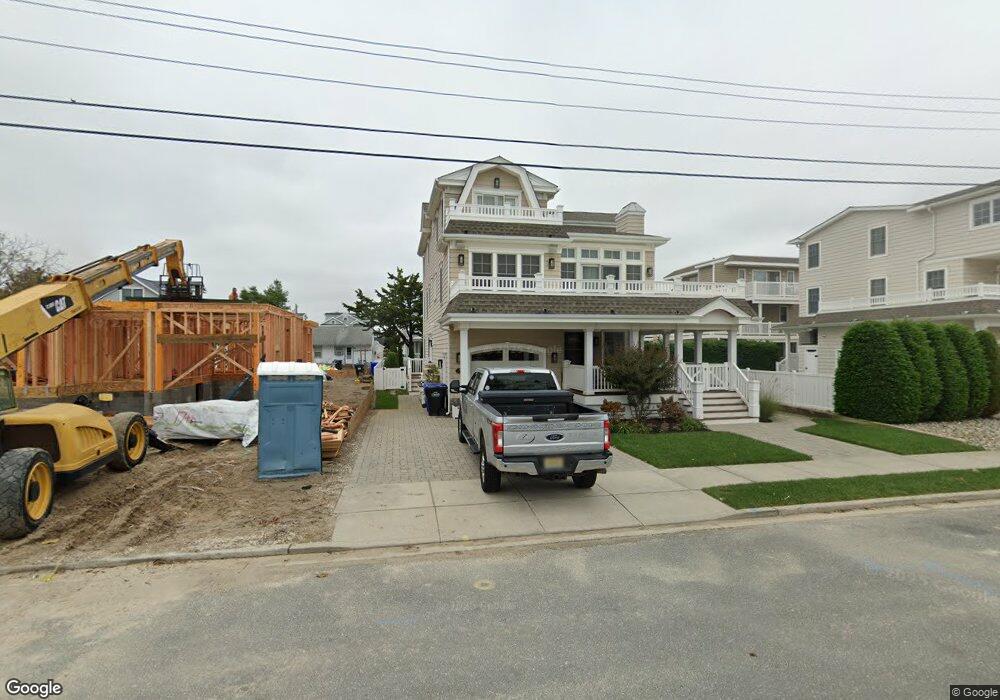
25 17th St E Avalon, NJ 08202
Estimated Value: $4,994,000 - $5,677,715
Studio
--
Bath
3,691
Sq Ft
$1,446/Sq Ft
Est. Value
About This Home
This home is located at 25 17th St E, Avalon, NJ 08202 and is currently estimated at $5,336,429, approximately $1,445 per square foot. 25 17th St E is a home located in Cape May County with nearby schools including Avalon Elementary School.
Ownership History
Date
Name
Owned For
Owner Type
Purchase Details
Closed on
Dec 18, 2018
Sold by
Combs Vicki S
Bought by
Combs Willliam H and Combs Vicki S
Current Estimated Value
Purchase Details
Closed on
Oct 28, 2013
Sold by
Griesser Gerard F and Griesser Mary O
Bought by
Combs Vicki S
Purchase Details
Closed on
Sep 11, 1989
Sold by
Griesser Joseph
Bought by
Griesser Gerard and Griesser Mary
Create a Home Valuation Report for This Property
The Home Valuation Report is an in-depth analysis detailing your home's value as well as a comparison with similar homes in the area
Home Values in the Area
Average Home Value in this Area
Purchase History
| Date | Buyer | Sale Price | Title Company |
|---|---|---|---|
| Combs Willliam H | -- | -- | |
| Combs Vicki S | $2,600,000 | Seaboard Title Agency | |
| Griesser Gerard | $115,000 | -- |
Source: Public Records
Tax History
| Year | Tax Paid | Tax Assessment Tax Assessment Total Assessment is a certain percentage of the fair market value that is determined by local assessors to be the total taxable value of land and additions on the property. | Land | Improvement |
|---|---|---|---|---|
| 2025 | $16,226 | $2,642,600 | $1,700,000 | $942,600 |
| 2024 | $16,226 | $2,642,600 | $1,700,000 | $942,600 |
| 2023 | $16,093 | $2,642,600 | $1,700,000 | $942,600 |
| 2022 | $15,010 | $2,642,600 | $1,700,000 | $942,600 |
| 2021 | $14,455 | $2,642,600 | $1,700,000 | $942,600 |
| 2020 | $13,900 | $2,642,600 | $1,700,000 | $942,600 |
| 2019 | $13,477 | $2,642,600 | $1,700,000 | $942,600 |
| 2018 | $12,896 | $2,642,600 | $1,700,000 | $942,600 |
| 2017 | $12,360 | $2,223,100 | $1,400,000 | $823,100 |
| 2016 | $12,227 | $2,223,100 | $1,400,000 | $823,100 |
| 2015 | $12,016 | $2,221,000 | $1,400,000 | $821,000 |
| 2014 | $11,882 | $2,221,000 | $1,400,000 | $821,000 |
Source: Public Records
Map
Nearby Homes
Your Personal Tour Guide
Ask me questions while you tour the home.