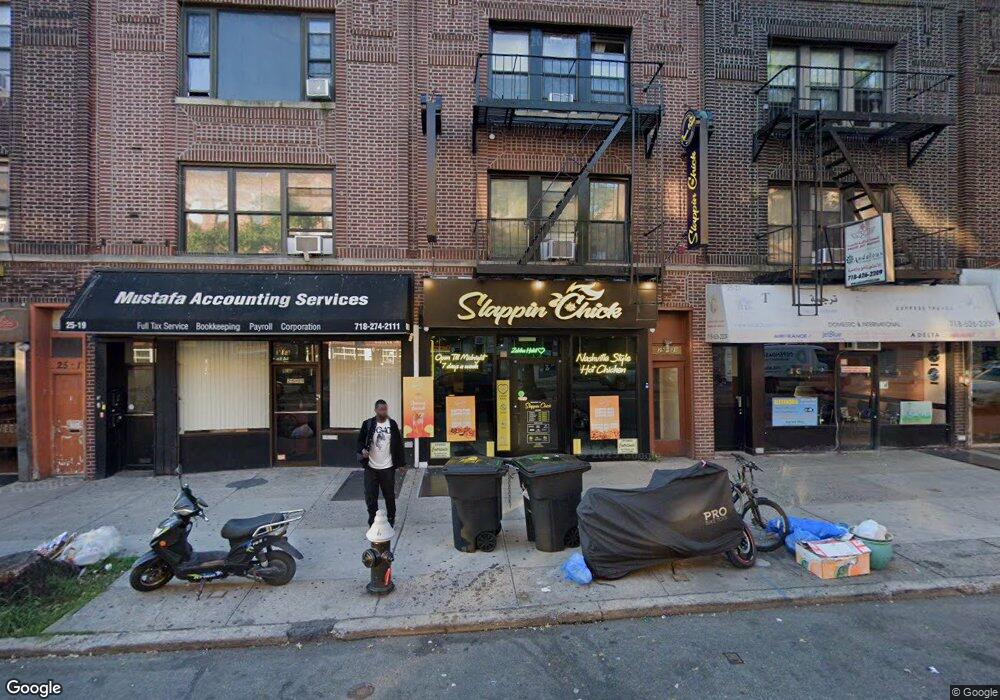
25-21 Steinway St Long Island City, NY 11103
Astoria NeighborhoodEstimated Value: $2,545,045
--
Bed
--
Bath
3,180
Sq Ft
$800/Sq Ft
Est. Value
About This Home
This home is located at 25-21 Steinway St, Long Island City, NY 11103 and is currently estimated at $2,545,045, approximately $800 per square foot. 25-21 Steinway St is a home located in Queens County with nearby schools including P.S. 070Q, I.S. 010 Horace Greeley, and William Cullen Bryant High School.
Ownership History
Date
Name
Owned For
Owner Type
Purchase Details
Closed on
Oct 30, 2024
Sold by
Li Leo
Bought by
Hui Zhang As Trustee and Leo Li Irrevocable Trust Ii
Current Estimated Value
Purchase Details
Closed on
Jul 11, 2022
Sold by
25-21 Steinway Realty Llc
Bought by
Lli 888 Llc
Home Financials for this Owner
Home Financials are based on the most recent Mortgage that was taken out on this home.
Original Mortgage
$1,000,000
Interest Rate
5.23%
Mortgage Type
Purchase Money Mortgage
Purchase Details
Closed on
Jan 16, 2020
Sold by
Mrkulic Nijazija and Mrkulic Ramiza
Bought by
25-21 Steinway Reallty Llc
Purchase Details
Closed on
Dec 30, 1999
Sold by
Bullaro Thomas and Bullaro Linda
Bought by
Mrkulic Nijazija and Mrkulic Ramiza
Home Financials for this Owner
Home Financials are based on the most recent Mortgage that was taken out on this home.
Original Mortgage
$286,000
Interest Rate
7.83%
Mortgage Type
Commercial
Create a Home Valuation Report for This Property
The Home Valuation Report is an in-depth analysis detailing your home's value as well as a comparison with similar homes in the area
Home Values in the Area
Average Home Value in this Area
Purchase History
| Date | Buyer | Sale Price | Title Company |
|---|---|---|---|
| Hui Zhang As Trustee | -- | -- | |
| Lli 888 Llc | $2,295,000 | -- | |
| Lli 888 Llc | $2,295,000 | -- | |
| 25-21 Steinway Reallty Llc | -- | -- | |
| 25-21 Steinway Reallty Llc | -- | -- | |
| Mrkulic Nijazija | $440,000 | Fidelity National Title | |
| Mrkulic Nijazija | $440,000 | Fidelity National Title |
Source: Public Records
Mortgage History
| Date | Status | Borrower | Loan Amount |
|---|---|---|---|
| Previous Owner | Lli 888 Llc | $1,000,000 | |
| Previous Owner | Mrkulic Nijazija | $286,000 |
Source: Public Records
Tax History Compared to Growth
Tax History
| Year | Tax Paid | Tax Assessment Tax Assessment Total Assessment is a certain percentage of the fair market value that is determined by local assessors to be the total taxable value of land and additions on the property. | Land | Improvement |
|---|---|---|---|---|
| 2025 | $28,429 | $237,862 | $110,368 | $127,494 |
| 2024 | $28,429 | $227,392 | $114,970 | $112,422 |
| 2023 | $26,323 | $210,549 | $99,053 | $111,496 |
| 2022 | $23,853 | $396,450 | $182,700 | $213,750 |
| 2021 | $22,445 | $342,450 | $182,700 | $159,750 |
| 2020 | $22,808 | $374,400 | $182,700 | $191,700 |
| 2019 | $19,561 | $375,840 | $182,700 | $193,140 |
| 2018 | $18,244 | $161,961 | $94,477 | $67,484 |
| 2017 | $16,948 | $149,966 | $93,098 | $56,868 |
| 2016 | $8,768 | $149,966 | $93,098 | $56,868 |
| 2015 | $5,593 | $140,747 | $97,514 | $43,233 |
| 2014 | $5,593 | $134,552 | $106,904 | $27,648 |
Source: Public Records
Map
Nearby Homes
- 24-75 38th St Unit C3
- 25-47 Steinway St
- 24-75 38th St Unit A1
- 24-75 38th St Unit 5C
- 24-75 38th St Unit A10
- 24-75 38th St Unit C9
- 24-65 38 St Unit D10
- 24-65 38th St Unit D4
- 24-65 38th St Unit A5
- 24-51 38th St Unit B7
- 24-39 38th St Unit B7B8
- 25-34 42nd St
- 25-63 38th St Unit 1A
- 2569 38th St Unit 1R
- 25-64 38th St
- 2549 42nd St
- 25-14 43rd St
- 43-13 25th Ave
- 25-14 44th St
- 43-16 25th Ave
- 25-21 Steinway St Unit 2F
- 2521 Steinway St
- 25-23 Steinway St Unit 1R
- 25-23 Steinway St Unit 3
- 25-23 Steinway St
- 2519 Steinway St
- 2523 Steinway St
- 2517 Steinway St
- 2525 Steinway St
- 25-27 Steinway St Unit 3R
- 2527 Steinway St
- 25-15 Steinway St
- 2515 Steinway St
- 2529 Steinway St
- 2531 Steinway St
- 2509 Steinway St
- 2520 41st St
- 2518 41st St
- 2524 41st St
- 2516 41st St