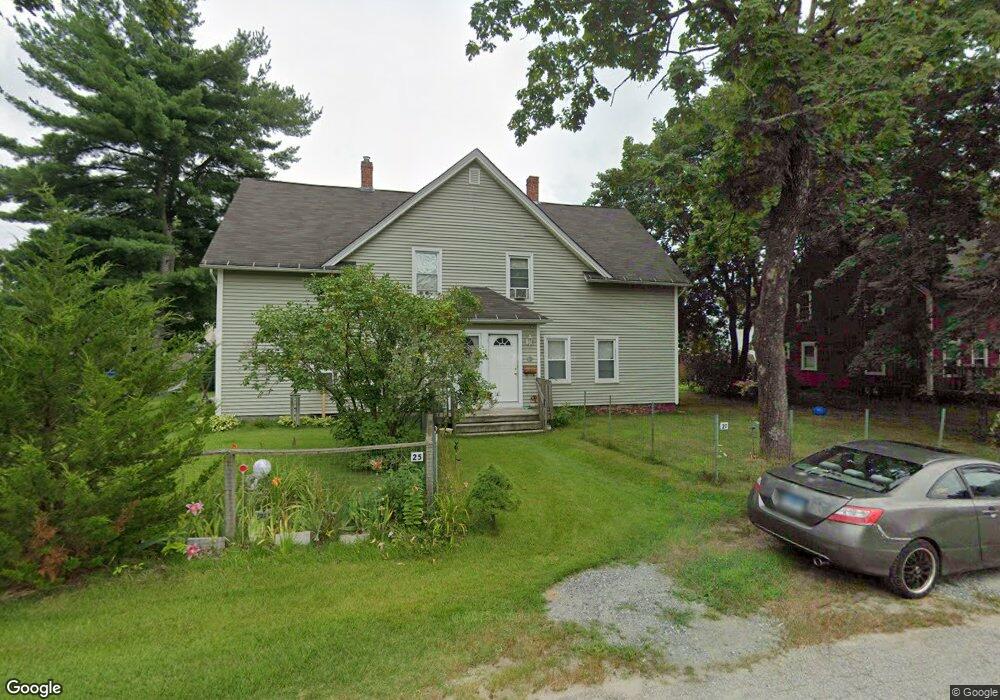
25-27 Third St Plainfield, CT 06374
Estimated Value: $285,095 - $372,000
6
Beds
2
Baths
2,673
Sq Ft
$128/Sq Ft
Est. Value
About This Home
This home is located at 25-27 Third St, Plainfield, CT 06374 and is currently estimated at $341,524, approximately $127 per square foot. 25-27 Third St is a home located in Windham County with nearby schools including Plainfield Memorial School, Plainfield Central Middle School, and Plainfield High School.
Ownership History
Date
Name
Owned For
Owner Type
Purchase Details
Closed on
Jul 17, 2014
Sold by
Hewlitt Lawrence and Hewlitt Paula J
Bought by
M & S Real Est Holdings
Current Estimated Value
Purchase Details
Closed on
Mar 13, 2012
Sold by
Deutsche Bank Natl T C
Bought by
Hewlitt Lawrence and Hewlitt Paula
Purchase Details
Closed on
Feb 23, 2010
Sold by
Savoie Scott T and New Century Mtg
Bought by
New Century Mtg
Purchase Details
Closed on
Jun 17, 2004
Sold by
Meyer Properties Llc
Bought by
Savoie Scott T and Savoie Cindy L
Home Financials for this Owner
Home Financials are based on the most recent Mortgage that was taken out on this home.
Original Mortgage
$157,700
Interest Rate
6.12%
Purchase Details
Closed on
Oct 17, 2002
Sold by
Peters John G
Bought by
Meyers John L and Meyer Victoria
Create a Home Valuation Report for This Property
The Home Valuation Report is an in-depth analysis detailing your home's value as well as a comparison with similar homes in the area
Home Values in the Area
Average Home Value in this Area
Purchase History
| Date | Buyer | Sale Price | Title Company |
|---|---|---|---|
| M & S Real Est Holdings | $125,000 | -- | |
| M & S Real Est Holdings | $125,000 | -- | |
| Hewlitt Lawrence | $84,000 | -- | |
| Hewlitt Lawrence | $84,000 | -- | |
| New Century Mtg | -- | -- | |
| New Century Mtg | -- | -- | |
| Savoie Scott T | $166,000 | -- | |
| Savoie Scott T | $166,000 | -- | |
| Meyers John L | $95,000 | -- | |
| Meyers John L | $95,000 | -- |
Source: Public Records
Mortgage History
| Date | Status | Borrower | Loan Amount |
|---|---|---|---|
| Previous Owner | Meyers John L | $157,700 |
Source: Public Records
Tax History
| Year | Tax Paid | Tax Assessment Tax Assessment Total Assessment is a certain percentage of the fair market value that is determined by local assessors to be the total taxable value of land and additions on the property. | Land | Improvement |
|---|---|---|---|---|
| 2025 | $2,878 | $123,830 | $25,020 | $98,810 |
| 2024 | $2,765 | $123,830 | $25,020 | $98,810 |
| 2023 | $2,752 | $123,830 | $25,020 | $98,810 |
| 2022 | $2,633 | $88,280 | $22,720 | $65,560 |
| 2021 | $2,660 | $88,280 | $22,720 | $65,560 |
| 2020 | $2,651 | $88,280 | $22,720 | $65,560 |
| 2019 | $2,651 | $88,280 | $22,720 | $65,560 |
| 2018 | $2,618 | $88,280 | $22,720 | $65,560 |
| 2017 | $2,849 | $90,100 | $20,040 | $70,060 |
| 2016 | $2,748 | $90,100 | $20,040 | $70,060 |
| 2015 | $2,686 | $90,100 | $20,040 | $70,060 |
| 2014 | $2,686 | $90,100 | $20,040 | $70,060 |
Source: Public Records
Map
Nearby Homes
- 11 Brookside
- 33 Railroad Ave
- 34 Pleasant St Unit 6
- 34 Pleasant St Unit 4
- 34 Pleasant St Unit 3
- 34 Pleasant St Unit 7
- 34 Pleasant St Unit 8
- 34 Pleasant St Unit 5
- 46 Pleasant St Unit 48
- 00 Norwich Rd
- 0A Norwich Rd
- 0 Pond St Unit 24037041
- 0 Dow Rd Unit 24128109
- 230 Cemetery Rd
- 36 Plainfield Pike
- 40 Tarbox Rd
- 0 West Pkwy
- 83 Kate Downing Rd
- 29 Old Canterbury Rd
- 184 Black Hill Rd
- 25 3rd St Unit 27
- 27 3rd St
- 29 3rd St Unit 31
- 21 3rd St Unit 23
- 26 2nd St Unit 28
- 14 3rd St Unit 16
- 30 2nd St Unit 32
- 24 2nd St
- 18 3rd St Unit 20
- 10 3rd St Unit 12
- 10-12 Third St
- 33 3rd St Unit 35
- 17 3rd St
- 17 3rd St Unit 19
- 17 3rd St
- 17 3rd St
- 18-20 2nd St
- 34 2nd St Unit 36
- 18 2nd St Unit 20
- 18-20 Second St
Your Personal Tour Guide
Ask me questions while you tour the home.