
Seller's Agent in 2025
Sam Peck
Horvath & Tremblay
(617) 910-1231
1 in this area
15 Total Sales
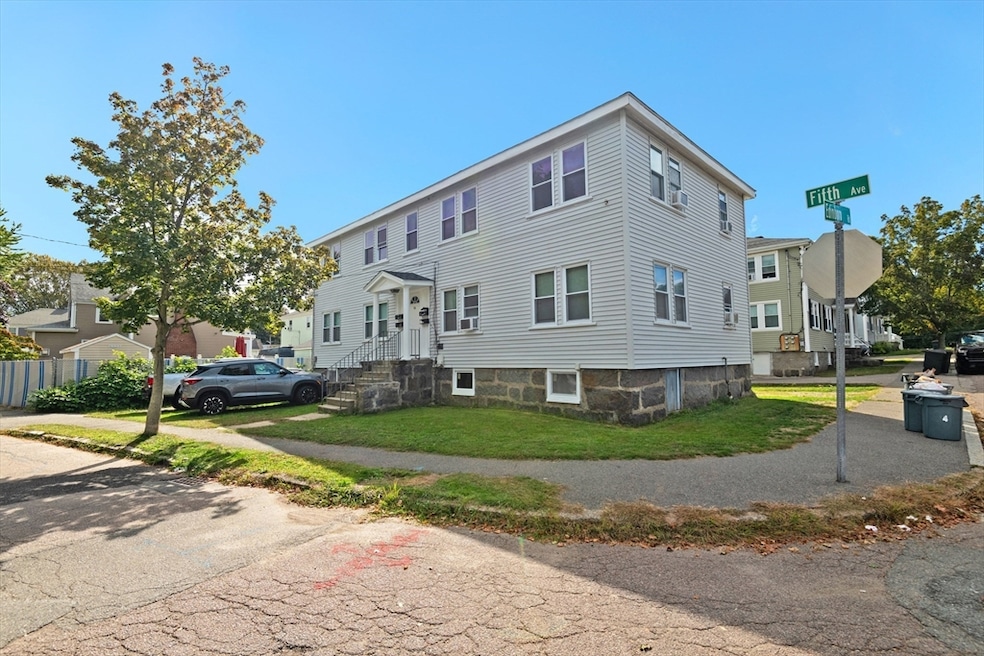


We are pleased to present the exclusive opportunity to purchase the multi-family investment property located at 25 Fifth Avenue in Quincy, MA. The two-story building contains four (4) 1-Bedroom/1-Bathroom units with 2,448 square feet of gross living area and 3,942 square feet of gross area. The Property is situated upon a 0.08- acre parcel and is situated on a corner lot of an inviting neighborhood and exciting community. The property provides excellent connectivity to major roadways, including Interstate 93 and Route 3, ensuring efficient access to Boston, Cambridge, and regional employment centers throughout eastern Massachusetts. In-place rents are significantly below the current market rates; the opportunity exists to continue to upgrade unit interiors and common areas to drive rental rates in an urban-infill, high demand/supply constrained residential market. Unit 3 to be delivered vacant.
| Date | Event | Price | List to Sale | Price per Sq Ft |
|---|---|---|---|---|
| 12/10/2025 12/10/25 | Sold | $1,150,000 | 0.0% | $470 / Sq Ft |
| 11/06/2025 11/06/25 | Pending | -- | -- | -- |
| 10/14/2025 10/14/25 | For Sale | $1,150,000 | -- | $470 / Sq Ft |
| Year | Tax Paid | Tax Assessment Tax Assessment Total Assessment is a certain percentage of the fair market value that is determined by local assessors to be the total taxable value of land and additions on the property. | Land | Improvement |
|---|---|---|---|---|
| 2025 | $9,622 | $834,500 | $245,600 | $588,900 |
| 2024 | $9,057 | $803,600 | $233,900 | $569,700 |
| 2023 | $8,256 | $741,800 | $212,600 | $529,200 |
| 2022 | $7,600 | $634,400 | $193,300 | $441,100 |
| 2021 | $7,367 | $606,800 | $193,300 | $413,500 |
| 2020 | $7,199 | $579,200 | $182,300 | $396,900 |
| 2019 | $6,813 | $542,900 | $168,800 | $374,100 |
| 2018 | $7,020 | $526,200 | $153,500 | $372,700 |
| 2017 | $6,136 | $433,000 | $146,200 | $286,800 |
| 2016 | $5,412 | $376,900 | $132,900 | $244,000 |
| 2015 | $5,218 | $357,400 | $125,300 | $232,100 |
| 2014 | $5,210 | $350,600 | $125,300 | $225,300 |
Seller's Agent in 2025
Sam Peck
Horvath & Tremblay
(617) 910-1231
1 in this area
15 Total Sales
Seller Co-Listing Agent in 2025
Jason Kulik
Horvath & Tremblay
(781) 776-4000
1 in this area
23 Total Sales
Source: MLS Property Information Network (MLS PIN)
MLS Number: 73443128
Disclaimer: Certain information contained herein is derived from information provided by parties other than Homes.com. All information provided is deemed reliable, but is not guaranteed to be accurate and should be independently verified.
![]() The property listing data and information, or the Images, set forth herein were provided to MLS Property Information Network, Inc. from third party sources, including sellers, lessors and public records, and were compiled by MLS Property Information Network, Inc. The property listing data and information, and the Images, are for the personal, non-commercial use of consumers having a good faith interest in purchasing or leasing listed properties of the type displayed to them and may not be used for any purpose other than to identify prospective properties which such consumers may have a good faith interest in purchasing or leasing. MLS Property Information Network, Inc. and its subscribers disclaim any and all representations and warranties as to the accuracy of the property listing data and information, or as to the accuracy of any of the Images, set forth herein.
The property listing data and information, or the Images, set forth herein were provided to MLS Property Information Network, Inc. from third party sources, including sellers, lessors and public records, and were compiled by MLS Property Information Network, Inc. The property listing data and information, and the Images, are for the personal, non-commercial use of consumers having a good faith interest in purchasing or leasing listed properties of the type displayed to them and may not be used for any purpose other than to identify prospective properties which such consumers may have a good faith interest in purchasing or leasing. MLS Property Information Network, Inc. and its subscribers disclaim any and all representations and warranties as to the accuracy of the property listing data and information, or as to the accuracy of any of the Images, set forth herein.
Ask me questions while you tour the home.