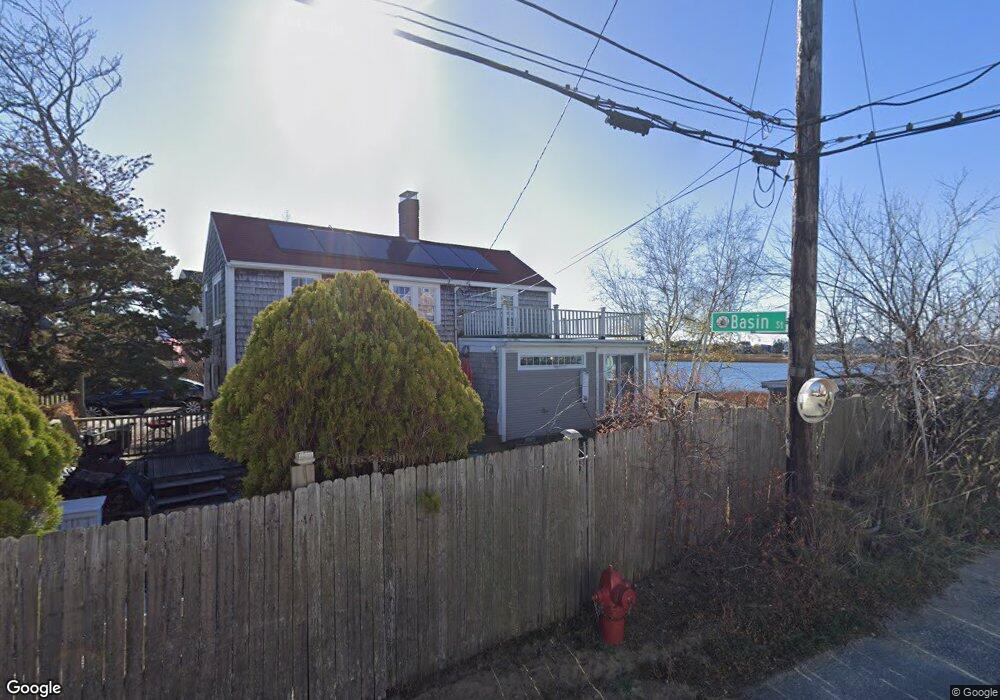
25 64th St Newburyport, MA 01950
Estimated Value: $1,123,607 - $1,470,000
3
Beds
1
Bath
1,292
Sq Ft
$1,003/Sq Ft
Est. Value
About This Home
This home is located at 25 64th St, Newburyport, MA 01950 and is currently estimated at $1,295,869, approximately $1,002 per square foot. 25 64th St is a home located in Essex County with nearby schools including Francis T. Bresnahan Elementary School, Edward G. Molin Elementary School, and Rupert A. Nock Middle School.
Ownership History
Date
Name
Owned For
Owner Type
Purchase Details
Closed on
Aug 30, 2018
Sold by
Kunkel Joanne L
Bought by
Georges Paul R and Knukel Joanne L
Current Estimated Value
Purchase Details
Closed on
Apr 1, 2004
Sold by
Kelly Peter G and Kelley Peter G
Bought by
Georges Paul R and Kunkel Joanne L
Home Financials for this Owner
Home Financials are based on the most recent Mortgage that was taken out on this home.
Original Mortgage
$250,000
Interest Rate
5.56%
Mortgage Type
Purchase Money Mortgage
Purchase Details
Closed on
May 21, 1999
Sold by
Stillwater Rt and Ostrander
Bought by
Kelley Peter G
Home Financials for this Owner
Home Financials are based on the most recent Mortgage that was taken out on this home.
Original Mortgage
$312,000
Interest Rate
6.88%
Mortgage Type
Purchase Money Mortgage
Create a Home Valuation Report for This Property
The Home Valuation Report is an in-depth analysis detailing your home's value as well as a comparison with similar homes in the area
Home Values in the Area
Average Home Value in this Area
Purchase History
| Date | Buyer | Sale Price | Title Company |
|---|---|---|---|
| Georges Paul R | -- | -- | |
| Kunkel Joanne L | -- | -- | |
| Georges Paul R | -- | -- | |
| Kunkel Joanne L | -- | -- | |
| Georges Paul R | $635,000 | -- | |
| Kelley Peter G | $390,000 | -- |
Source: Public Records
Mortgage History
| Date | Status | Borrower | Loan Amount |
|---|---|---|---|
| Previous Owner | Kelley Peter G | $250,000 | |
| Previous Owner | Kelley Peter G | $312,000 | |
| Previous Owner | Kelley Peter G | $9,075 |
Source: Public Records
Tax History Compared to Growth
Tax History
| Year | Tax Paid | Tax Assessment Tax Assessment Total Assessment is a certain percentage of the fair market value that is determined by local assessors to be the total taxable value of land and additions on the property. | Land | Improvement |
|---|---|---|---|---|
| 2025 | $10,938 | $1,141,800 | $829,600 | $312,200 |
| 2024 | $10,359 | $1,039,000 | $754,100 | $284,900 |
| 2023 | $9,767 | $909,400 | $624,500 | $284,900 |
| 2022 | $9,161 | $762,800 | $520,400 | $242,400 |
| 2021 | $8,934 | $706,800 | $473,100 | $233,700 |
| 2020 | $8,940 | $696,300 | $473,100 | $223,200 |
| 2019 | $8,894 | $680,000 | $473,100 | $206,900 |
| 2018 | $8,595 | $648,200 | $450,700 | $197,500 |
| 2017 | $8,351 | $620,900 | $429,200 | $191,700 |
| 2016 | $7,962 | $594,600 | $398,500 | $196,100 |
| 2015 | $7,725 | $579,100 | $398,500 | $180,600 |
Source: Public Records
Map
Nearby Homes
- 4 54th St
- 12 53rd St
- 11 Harbor St
- 12 Barker St
- 5 Helena St
- 44 Old Point Rd
- 5 Northern Blvd
- 2 Plum Island Blvd
- 10 Meadowview Ln Unit B
- 2 Sunset Dr
- 28 & 30 Plum Island Turnpike
- 65 Plum Island Turnpike
- 141 Atlantic Ave
- 116 Railroad Ave
- 114 Railroad Ave
- 52 Brissette Ave
- 103 Railroad Ave
- 33 Union St
- 4 Goodwin Ave
- 20 Cable Ave Unit 11