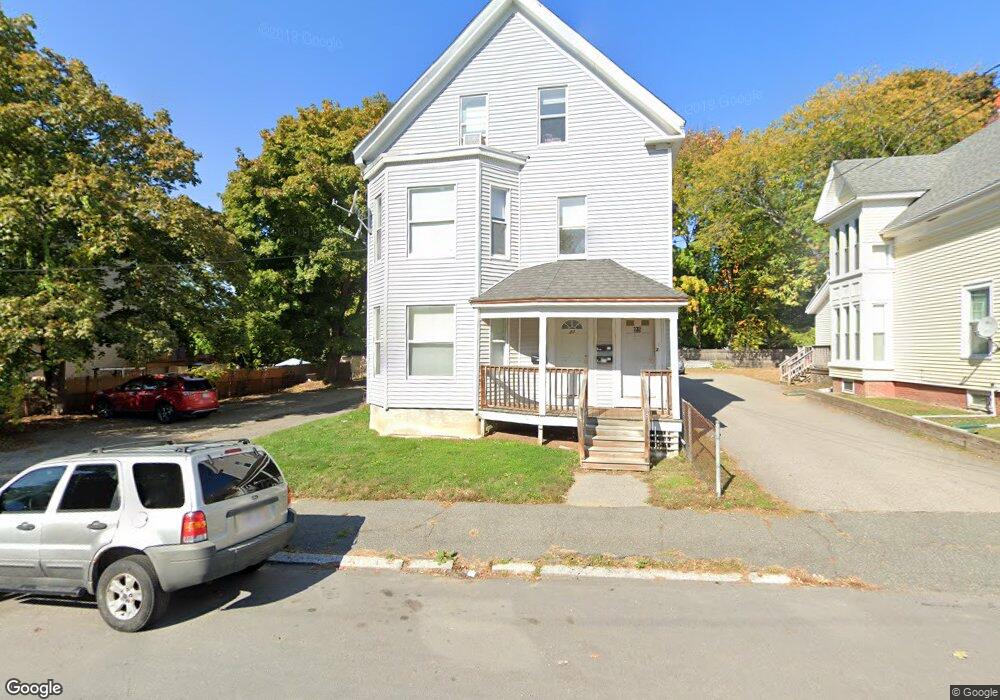
25 7th Ave Unit 27 Haverhill, MA 01830
Lower Acres NeighborhoodEstimated Value: $621,000 - $792,000
9
Beds
3
Baths
2,559
Sq Ft
$277/Sq Ft
Est. Value
About This Home
This home is located at 25 7th Ave Unit 27, Haverhill, MA 01830 and is currently estimated at $708,667, approximately $276 per square foot. 25 7th Ave Unit 27 is a home located in Essex County with nearby schools including Pentucket Lake Elementary School and Haverhill High School.
Ownership History
Date
Name
Owned For
Owner Type
Purchase Details
Closed on
Oct 22, 2010
Sold by
Keefe Holdings Llc
Bought by
Pertus Aaron
Current Estimated Value
Purchase Details
Closed on
Jun 28, 2010
Sold by
Mclaughlin Philip
Bought by
Keefe Holdings Llc
Home Financials for this Owner
Home Financials are based on the most recent Mortgage that was taken out on this home.
Original Mortgage
$330,000
Interest Rate
4.98%
Mortgage Type
Purchase Money Mortgage
Purchase Details
Closed on
Mar 3, 2010
Sold by
Glaser Mark G and Aurora Loan Svcs Llc
Bought by
Fhlmc
Purchase Details
Closed on
Jan 18, 2005
Sold by
Lahlou Chahine and Lahlou Sarah
Bought by
Glaser Mark G
Purchase Details
Closed on
Oct 20, 2003
Sold by
Bonarrigo Scott
Bought by
Lahlou Chahine and Lahlou Sarah
Purchase Details
Closed on
May 28, 2003
Sold by
Kratman Kurt
Bought by
Bonarrigo Scott J
Purchase Details
Closed on
Sep 8, 2000
Sold by
Avatar Financial Servi and Annson
Bought by
Kratman Kurt
Create a Home Valuation Report for This Property
The Home Valuation Report is an in-depth analysis detailing your home's value as well as a comparison with similar homes in the area
Home Values in the Area
Average Home Value in this Area
Purchase History
| Date | Buyer | Sale Price | Title Company |
|---|---|---|---|
| Pertus Aaron | $182,000 | -- | |
| Keefe Holdings Llc | -- | -- | |
| Mclaughlin Philip | $135,000 | -- | |
| Fhlmc | $202,572 | -- | |
| Glaser Mark G | $400,000 | -- | |
| Lahlou Chahine | $320,000 | -- | |
| Bonarrigo Scott J | $235,000 | -- | |
| Kratman Kurt | $85,000 | -- |
Source: Public Records
Mortgage History
| Date | Status | Borrower | Loan Amount |
|---|---|---|---|
| Previous Owner | Kratman Kurt | $330,000 |
Source: Public Records
Tax History Compared to Growth
Tax History
| Year | Tax Paid | Tax Assessment Tax Assessment Total Assessment is a certain percentage of the fair market value that is determined by local assessors to be the total taxable value of land and additions on the property. | Land | Improvement |
|---|---|---|---|---|
| 2025 | $6,485 | $605,500 | $142,600 | $462,900 |
| 2024 | $6,046 | $568,200 | $141,100 | $427,100 |
| 2023 | $5,766 | $517,100 | $129,100 | $388,000 |
| 2022 | $5,452 | $428,600 | $117,100 | $311,500 |
| 2021 | $5,164 | $384,200 | $102,100 | $282,100 |
| 2020 | $4,937 | $363,000 | $94,600 | $268,400 |
| 2019 | $4,623 | $331,400 | $82,600 | $248,800 |
| 2018 | $4,441 | $311,400 | $78,100 | $233,300 |
| 2017 | $3,857 | $257,300 | $63,100 | $194,200 |
| 2016 | $3,868 | $251,800 | $63,100 | $188,700 |
| 2015 | $3,633 | $236,700 | $63,100 | $173,600 |
Source: Public Records
Map
Nearby Homes
- 34 7th Ave
- 21 7th Ave
- 6 Dexter St
- 434 Main St
- 192 Franklin St
- 25-27 Dover St
- 151 Franklin St
- 16 Dudley St
- 16 Fountain St
- 5 Kimball St
- 11 York St Unit 11
- 9 York St Unit 9
- 33 Hamilton Ave
- 48 Portland St
- 20 Ashland St
- 100 Lawrence St Unit 5
- 13-15 Arlington St
- 23 Arlington St
- 17 Arlington St
- 70 Brockton Ave