25 Alan St Tiverton, RI 02878
North Tiverton NeighborhoodEstimated Value: $430,000 - $482,000
3
Beds
1
Bath
1,120
Sq Ft
$410/Sq Ft
Est. Value
About This Home
This home is located at 25 Alan St, Tiverton, RI 02878 and is currently estimated at $458,889, approximately $409 per square foot. 25 Alan St is a home located in Newport County with nearby schools including Tiverton High School, Argosy Collegiate Charter School, and Holy Trinity School.
Ownership History
Date
Name
Owned For
Owner Type
Purchase Details
Closed on
Jul 3, 2006
Sold by
Makuch David
Bought by
Olsen Parrish
Current Estimated Value
Home Financials for this Owner
Home Financials are based on the most recent Mortgage that was taken out on this home.
Original Mortgage
$212,000
Outstanding Balance
$125,372
Interest Rate
6.58%
Mortgage Type
Purchase Money Mortgage
Estimated Equity
$333,517
Purchase Details
Closed on
Oct 29, 1999
Sold by
Szaro Genevieve Est
Bought by
Imbeau Mark R
Home Financials for this Owner
Home Financials are based on the most recent Mortgage that was taken out on this home.
Original Mortgage
$87,685
Interest Rate
7.78%
Create a Home Valuation Report for This Property
The Home Valuation Report is an in-depth analysis detailing your home's value as well as a comparison with similar homes in the area
Home Values in the Area
Average Home Value in this Area
Purchase History
| Date | Buyer | Sale Price | Title Company |
|---|---|---|---|
| Olsen Parrish | $245,000 | -- | |
| Imbeau Mark R | $92,500 | -- |
Source: Public Records
Mortgage History
| Date | Status | Borrower | Loan Amount |
|---|---|---|---|
| Open | Imbeau Mark R | $212,000 | |
| Closed | Imbeau Mark R | $52,900 | |
| Previous Owner | Imbeau Mark R | $87,685 |
Source: Public Records
Tax History
| Year | Tax Paid | Tax Assessment Tax Assessment Total Assessment is a certain percentage of the fair market value that is determined by local assessors to be the total taxable value of land and additions on the property. | Land | Improvement |
|---|---|---|---|---|
| 2025 | $3,597 | $325,500 | $113,100 | $212,400 |
| 2024 | $3,597 | $325,500 | $113,100 | $212,400 |
| 2023 | $3,838 | $257,600 | $104,700 | $152,900 |
| 2022 | $3,769 | $257,600 | $104,700 | $152,900 |
| 2021 | $3,676 | $257,600 | $104,700 | $152,900 |
| 2020 | $3,746 | $231,400 | $77,400 | $154,000 |
| 2019 | $3,654 | $231,400 | $77,400 | $154,000 |
| 2018 | $3,793 | $231,400 | $77,400 | $154,000 |
| 2017 | $3,280 | $172,200 | $74,900 | $97,300 |
| 2016 | $3,296 | $172,200 | $74,900 | $97,300 |
| 2015 | $3,296 | $172,200 | $74,900 | $97,300 |
| 2014 | $3,271 | $169,500 | $71,900 | $97,600 |
Source: Public Records
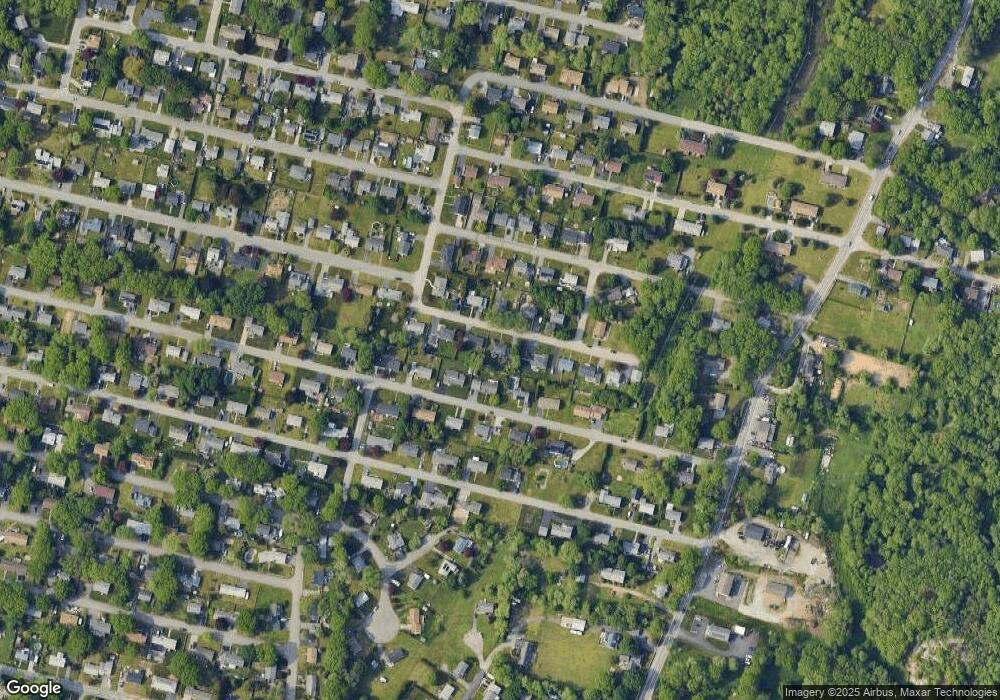
Map
Nearby Homes
Your Personal Tour Guide
Ask me questions while you tour the home.