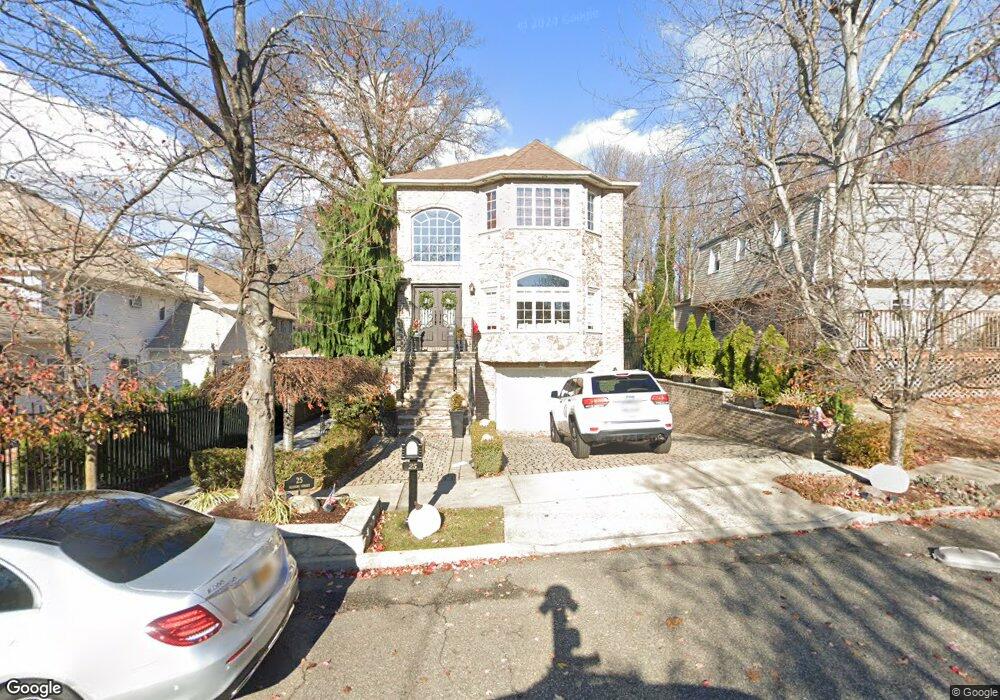
25 Allegro St Staten Island, NY 10312
Huguenot NeighborhoodEstimated Value: $1,061,030 - $1,195,000
--
Bed
4
Baths
2,592
Sq Ft
$427/Sq Ft
Est. Value
About This Home
This home is located at 25 Allegro St, Staten Island, NY 10312 and is currently estimated at $1,107,008, approximately $427 per square foot. 25 Allegro St is a home located in Richmond County with nearby schools including P.S. 5 - Huguenot, I.S. 007 Elias Bernstein, and Tottenville High School.
Ownership History
Date
Name
Owned For
Owner Type
Purchase Details
Closed on
Aug 10, 2007
Sold by
Truesdale Tracy
Bought by
Graziano Anthony
Current Estimated Value
Home Financials for this Owner
Home Financials are based on the most recent Mortgage that was taken out on this home.
Original Mortgage
$713,000
Outstanding Balance
$463,767
Interest Rate
6.63%
Mortgage Type
Construction
Estimated Equity
$643,241
Create a Home Valuation Report for This Property
The Home Valuation Report is an in-depth analysis detailing your home's value as well as a comparison with similar homes in the area
Home Values in the Area
Average Home Value in this Area
Purchase History
| Date | Buyer | Sale Price | Title Company |
|---|---|---|---|
| Graziano Anthony | $390,000 | Ticor Title Insurance Co |
Source: Public Records
Mortgage History
| Date | Status | Borrower | Loan Amount |
|---|---|---|---|
| Open | Graziano Anthony | $713,000 |
Source: Public Records
Tax History Compared to Growth
Tax History
| Year | Tax Paid | Tax Assessment Tax Assessment Total Assessment is a certain percentage of the fair market value that is determined by local assessors to be the total taxable value of land and additions on the property. | Land | Improvement |
|---|---|---|---|---|
| 2025 | $11,312 | $62,580 | $10,957 | $51,623 |
| 2024 | $11,324 | $57,720 | $11,491 | $46,229 |
| 2023 | $10,804 | $54,600 | $11,774 | $42,826 |
| 2022 | $10,277 | $52,920 | $11,460 | $41,460 |
| 2021 | $10,820 | $53,460 | $11,460 | $42,000 |
| 2020 | $10,258 | $49,860 | $11,460 | $38,400 |
| 2019 | $10,602 | $52,080 | $11,460 | $40,620 |
| 2018 | $9,859 | $49,824 | $9,603 | $40,221 |
| 2017 | $9,801 | $49,550 | $10,389 | $39,161 |
| 2016 | $9,035 | $46,746 | $9,000 | $37,746 |
| 2015 | $8,141 | $44,100 | $9,540 | $34,560 |
| 2014 | $8,141 | $44,011 | $8,431 | $35,580 |
Source: Public Records
Map
Nearby Homes
- 311 Bertram Ave
- 314 Bertram Ave
- 304 Bertram Ave
- 115 Jansen St
- 383 Philip Ave
- 344 Poillon Ave
- 389 Philip Ave
- 350 Poillon Ave
- 393 Philip Ave
- 59 Newton St
- 381 Arbutus Ave
- 10 Arbutus Way
- 52 Nicolosi Loop
- 16 Nicolosi Loop
- 84 Discala Ln
- 45 Joanne Ct
- 262 Noel St
- 151 Lipsett Ave
- 54 Poillon Ave
- 50 Poillon Ave