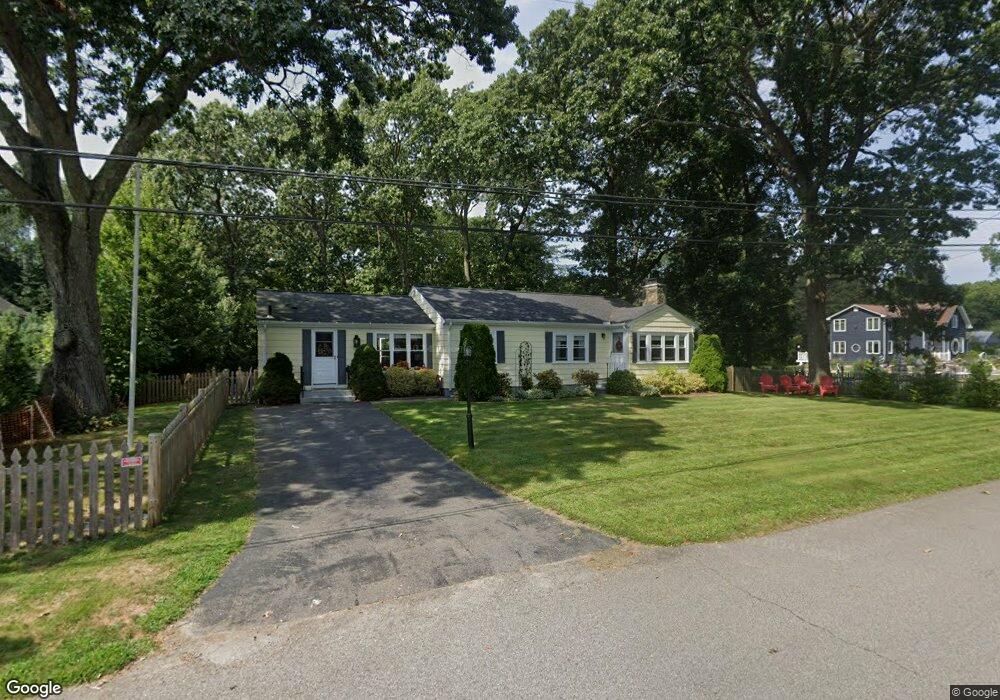
25 Anthony Rd Barrington, RI 02806
North Barrington NeighborhoodEstimated Value: $582,877 - $759,000
3
Beds
2
Baths
1,510
Sq Ft
$444/Sq Ft
Est. Value
About This Home
This home is located at 25 Anthony Rd, Barrington, RI 02806 and is currently estimated at $669,719, approximately $443 per square foot. 25 Anthony Rd is a home located in Bristol County with nearby schools including Barrington High School, St Luke Elementary School, and St Mary Academy-Bay View.
Ownership History
Date
Name
Owned For
Owner Type
Purchase Details
Closed on
Jul 20, 2015
Sold by
Moura Edmund P
Bought by
Edmund E Moura Ft
Current Estimated Value
Purchase Details
Closed on
Jun 11, 2015
Sold by
Edmund E Moura Ft
Bought by
Kassel Jayne
Home Financials for this Owner
Home Financials are based on the most recent Mortgage that was taken out on this home.
Original Mortgage
$105,000
Interest Rate
3.76%
Mortgage Type
New Conventional
Purchase Details
Closed on
May 1, 2015
Sold by
Edmund E Moura Ft
Bought by
Andrade Jimmy K
Home Financials for this Owner
Home Financials are based on the most recent Mortgage that was taken out on this home.
Original Mortgage
$105,000
Interest Rate
3.76%
Mortgage Type
New Conventional
Purchase Details
Closed on
Jul 27, 2011
Sold by
Moura Edmund P
Bought by
Edmund E Moura Ft
Create a Home Valuation Report for This Property
The Home Valuation Report is an in-depth analysis detailing your home's value as well as a comparison with similar homes in the area
Home Values in the Area
Average Home Value in this Area
Purchase History
| Date | Buyer | Sale Price | Title Company |
|---|---|---|---|
| Edmund E Moura Ft | -- | -- | |
| Kassel Jayne | $230,000 | -- | |
| Andrade Jimmy K | $150,000 | -- | |
| Edmund E Moura Ft | -- | -- |
Source: Public Records
Mortgage History
| Date | Status | Borrower | Loan Amount |
|---|---|---|---|
| Previous Owner | Edmund E Moura Ft | $105,000 |
Source: Public Records
Tax History
| Year | Tax Paid | Tax Assessment Tax Assessment Total Assessment is a certain percentage of the fair market value that is determined by local assessors to be the total taxable value of land and additions on the property. | Land | Improvement |
|---|---|---|---|---|
| 2025 | $6,581 | $429,000 | $236,000 | $193,000 |
| 2024 | $6,328 | $429,000 | $236,000 | $193,000 |
| 2023 | $6,090 | $300,000 | $148,000 | $152,000 |
| 2022 | $5,895 | $300,000 | $148,000 | $152,000 |
| 2021 | $5,745 | $300,000 | $148,000 | $152,000 |
| 2020 | $5,497 | $263,000 | $125,000 | $138,000 |
| 2019 | $5,286 | $263,000 | $125,000 | $138,000 |
| 2018 | $5,129 | $263,000 | $125,000 | $138,000 |
| 2017 | $5,034 | $251,700 | $123,700 | $128,000 |
| 2016 | $4,644 | $251,700 | $123,700 | $128,000 |
| 2015 | $4,594 | $251,700 | $123,700 | $128,000 |
| 2014 | $5,000 | $273,200 | $126,200 | $147,000 |
Source: Public Records
Map
Nearby Homes
Your Personal Tour Guide
Ask me questions while you tour the home.