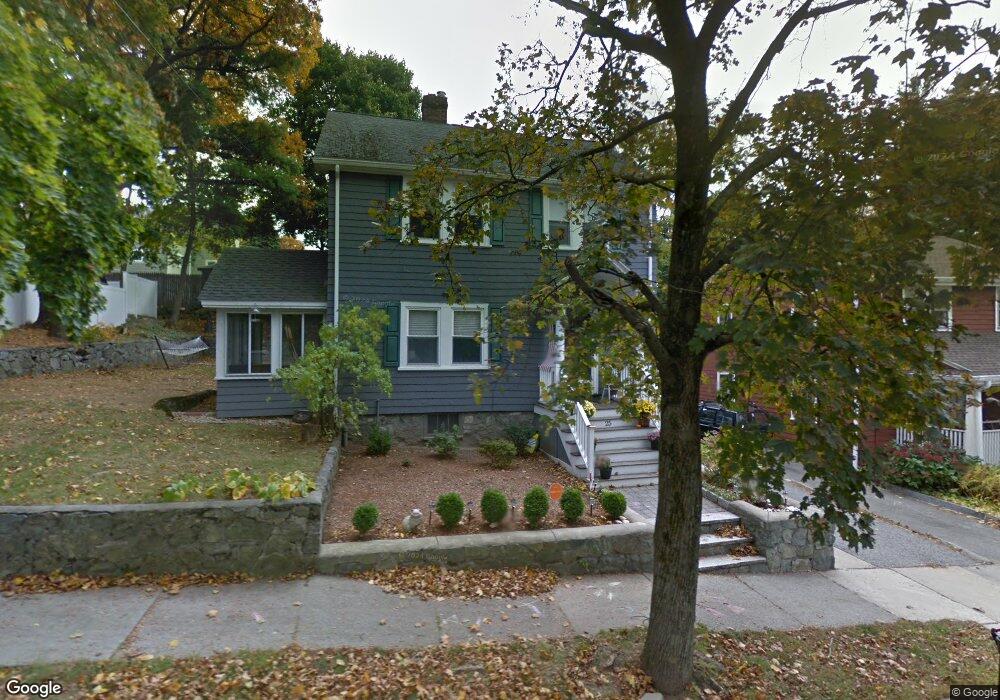
25 Appleton St Melrose, MA 02176
Melrose East Side NeighborhoodEstimated Value: $763,000 - $909,000
3
Beds
1
Bath
1,352
Sq Ft
$605/Sq Ft
Est. Value
About This Home
This home is located at 25 Appleton St, Melrose, MA 02176 and is currently estimated at $818,312, approximately $605 per square foot. 25 Appleton St is a home located in Middlesex County with nearby schools including Hoover Elementary School, Lincoln Elementary School, and Winthrop Elementary School.
Ownership History
Date
Name
Owned For
Owner Type
Purchase Details
Closed on
Dec 10, 2010
Sold by
Kaliris William and Kaliris Denise C
Bought by
Oneil Michael P and Oneil Allison L
Current Estimated Value
Home Financials for this Owner
Home Financials are based on the most recent Mortgage that was taken out on this home.
Original Mortgage
$284,000
Outstanding Balance
$186,358
Interest Rate
4.24%
Mortgage Type
Purchase Money Mortgage
Estimated Equity
$631,954
Purchase Details
Closed on
May 11, 1989
Sold by
Sibley Hester Est
Bought by
Cinella Denise M
Home Financials for this Owner
Home Financials are based on the most recent Mortgage that was taken out on this home.
Original Mortgage
$110,000
Interest Rate
11.14%
Mortgage Type
Purchase Money Mortgage
Create a Home Valuation Report for This Property
The Home Valuation Report is an in-depth analysis detailing your home's value as well as a comparison with similar homes in the area
Home Values in the Area
Average Home Value in this Area
Purchase History
| Date | Buyer | Sale Price | Title Company |
|---|---|---|---|
| Oneil Michael P | $355,000 | -- | |
| Cinella Denise M | $145,000 | -- |
Source: Public Records
Mortgage History
| Date | Status | Borrower | Loan Amount |
|---|---|---|---|
| Open | Oneil Michael P | $284,000 | |
| Previous Owner | Cinella Denise M | $180,000 | |
| Previous Owner | Cinella Denise M | $30,000 | |
| Previous Owner | Cinella Denise M | $110,000 |
Source: Public Records
Tax History
| Year | Tax Paid | Tax Assessment Tax Assessment Total Assessment is a certain percentage of the fair market value that is determined by local assessors to be the total taxable value of land and additions on the property. | Land | Improvement |
|---|---|---|---|---|
| 2025 | $72 | $725,500 | $447,000 | $278,500 |
| 2024 | $6,935 | $698,400 | $419,900 | $278,500 |
| 2023 | $6,888 | $661,000 | $406,300 | $254,700 |
| 2022 | $6,885 | $651,400 | $406,300 | $245,100 |
| 2021 | $6,700 | $611,900 | $379,200 | $232,700 |
| 2020 | $6,314 | $571,400 | $338,600 | $232,800 |
| 2019 | $5,690 | $526,400 | $312,900 | $213,500 |
| 2018 | $5,641 | $497,900 | $284,400 | $213,500 |
| 2017 | $5,527 | $468,400 | $270,900 | $197,500 |
| 2016 | $5,504 | $446,400 | $264,100 | $182,300 |
| 2015 | $5,022 | $387,500 | $237,000 | $150,500 |
| 2014 | $4,786 | $360,400 | $209,900 | $150,500 |
Source: Public Records
Map
Nearby Homes
- 0 Beech Ave
- 77 Lynde St
- 31 Temple St
- 65 Beacon St
- 70 Sylvan St
- 333 Main St
- 340 Main St Unit 508
- 340 Main St Unit 206
- 30 Wheeler Ave
- 244 Main St
- 0 S Mountain Avenue & O Cargil
- 236-238 Main St
- 447 Pleasant St
- 515 Pleasant St Unit 1-1
- 509 Pleasant St Unit 1-4
- 187 Laurel St
- 3 Hunnewell St
- 232 Pleasant St
- 1 Mill Rd
- 114-116 W Wyoming Ave Unit 1
Your Personal Tour Guide
Ask me questions while you tour the home.