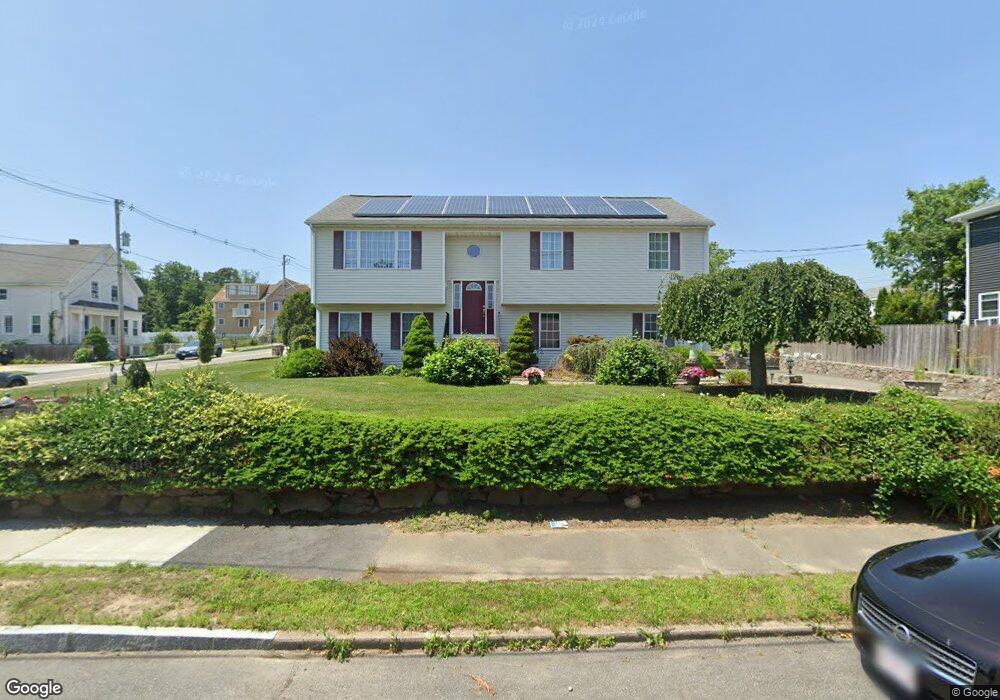
25 Ashley St South Dartmouth, MA 02748
Bliss Corner NeighborhoodEstimated Value: $454,000 - $523,390
3
Beds
2
Baths
1,332
Sq Ft
$362/Sq Ft
Est. Value
About This Home
This home is located at 25 Ashley St, South Dartmouth, MA 02748 and is currently estimated at $482,848, approximately $362 per square foot. 25 Ashley St is a home located in Bristol County with nearby schools including Dartmouth High School and St. Teresa of Calcutta School.
Ownership History
Date
Name
Owned For
Owner Type
Purchase Details
Closed on
Jun 12, 2017
Sold by
Ponte Joseph and Ponte Rosalina M
Bought by
Ponte Children Irt 201
Current Estimated Value
Purchase Details
Closed on
Jan 11, 2005
Sold by
Santos David and Ponte Kevin
Bought by
Ponte Joseph and Ponte Rosalina M
Home Financials for this Owner
Home Financials are based on the most recent Mortgage that was taken out on this home.
Original Mortgage
$85,000
Interest Rate
5.75%
Mortgage Type
Purchase Money Mortgage
Purchase Details
Closed on
Sep 19, 2003
Sold by
Storey Linda A
Bought by
Santos David and Ponte Kevin
Purchase Details
Closed on
Aug 22, 2000
Sold by
Miranda Francisco and Miranda Deolinda C
Bought by
Storey Linda A
Home Financials for this Owner
Home Financials are based on the most recent Mortgage that was taken out on this home.
Original Mortgage
$25,000
Interest Rate
8.13%
Mortgage Type
Purchase Money Mortgage
Create a Home Valuation Report for This Property
The Home Valuation Report is an in-depth analysis detailing your home's value as well as a comparison with similar homes in the area
Home Values in the Area
Average Home Value in this Area
Purchase History
| Date | Buyer | Sale Price | Title Company |
|---|---|---|---|
| Ponte Children Irt 201 | -- | -- | |
| Ponte Joseph | $240,000 | -- | |
| Santos David | $129,000 | -- | |
| Storey Linda A | $25,000 | -- |
Source: Public Records
Mortgage History
| Date | Status | Borrower | Loan Amount |
|---|---|---|---|
| Previous Owner | Storey Linda A | $85,000 | |
| Previous Owner | Storey Linda A | $25,000 |
Source: Public Records
Tax History Compared to Growth
Tax History
| Year | Tax Paid | Tax Assessment Tax Assessment Total Assessment is a certain percentage of the fair market value that is determined by local assessors to be the total taxable value of land and additions on the property. | Land | Improvement |
|---|---|---|---|---|
| 2025 | $3,751 | $435,700 | $123,500 | $312,200 |
| 2024 | $3,697 | $425,400 | $123,500 | $301,900 |
| 2023 | $3,554 | $387,600 | $123,500 | $264,100 |
| 2022 | $3,592 | $359,200 | $123,500 | $235,700 |
| 2021 | $3,579 | $345,500 | $119,900 | $225,600 |
| 2020 | $3,463 | $333,600 | $118,700 | $214,900 |
| 2019 | $3,285 | $315,900 | $113,900 | $202,000 |
| 2018 | $2,983 | $297,400 | $116,300 | $181,100 |
| 2017 | $2,910 | $290,400 | $107,400 | $183,000 |
| 2016 | $2,705 | $266,200 | $95,000 | $171,200 |
| 2015 | $2,654 | $261,700 | $88,700 | $173,000 |
| 2014 | $2,605 | $255,100 | $86,300 | $168,800 |
Source: Public Records
Map
Nearby Homes