25 Aurora Ave Centerville, MA 02632
Centerville NeighborhoodEstimated Value: $511,704 - $674,000
3
Beds
1
Bath
1,152
Sq Ft
$517/Sq Ft
Est. Value
About This Home
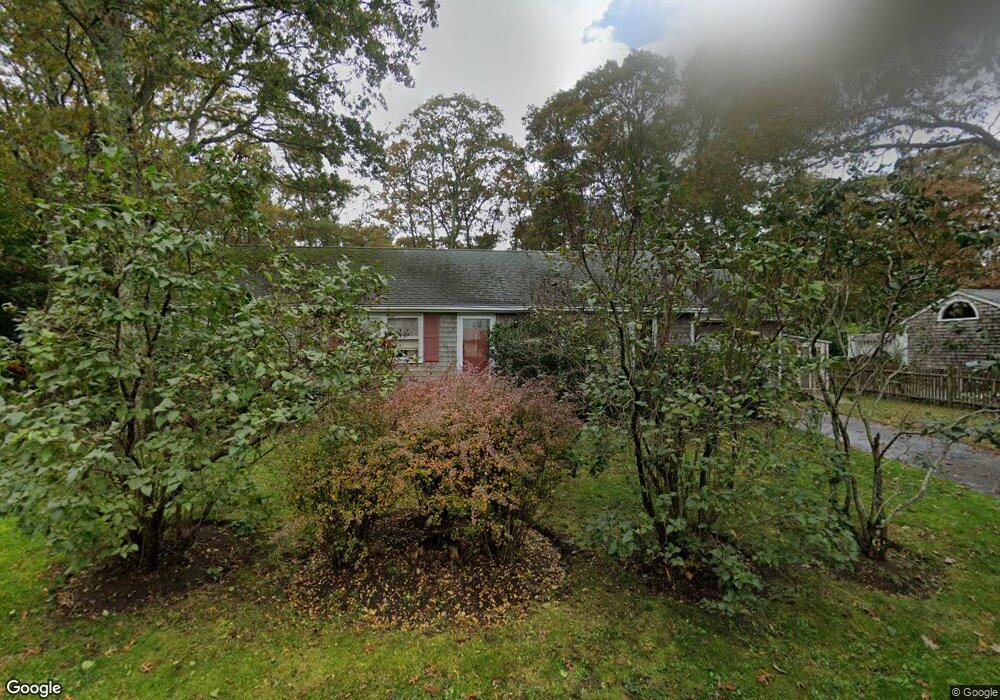
This home is located at 25 Aurora Ave, Centerville, MA 02632 and is currently estimated at $595,426, approximately $516 per square foot. 25 Aurora Ave is a home located in Barnstable County with nearby schools including Centerville Elementary School, Barnstable United Elementary School, and Barnstable Intermediate School.
Ownership History
Date
Name
Owned For
Owner Type
Purchase Details
Closed on
Dec 11, 2023
Sold by
Cynthia A Welsch Kelley T A and Cynthia Dzenawagis
Bought by
Dzenawagis Amanda
Current Estimated Value
Purchase Details
Closed on
Oct 20, 2021
Sold by
Welsch-Kelley Cynthia A
Bought by
C A Welsch Kelley Ret and Welsch-Kelley
Purchase Details
Closed on
Jan 31, 1994
Sold by
Dzenawagis Lynda M and Walch Kelley Cynthia
Bought by
Welsch Kelly Cynthia A and Kelley Barry J
Home Financials for this Owner
Home Financials are based on the most recent Mortgage that was taken out on this home.
Original Mortgage
$107,100
Interest Rate
7.11%
Mortgage Type
Purchase Money Mortgage
Purchase Details
Closed on
Apr 1, 1988
Sold by
Dahl George E
Bought by
Dzenaqagis Lynda
Home Financials for this Owner
Home Financials are based on the most recent Mortgage that was taken out on this home.
Original Mortgage
$100,000
Interest Rate
9.89%
Mortgage Type
Purchase Money Mortgage
Create a Home Valuation Report for This Property
The Home Valuation Report is an in-depth analysis detailing your home's value as well as a comparison with similar homes in the area
Home Values in the Area
Average Home Value in this Area
Purchase History
| Date | Buyer | Sale Price | Title Company |
|---|---|---|---|
| Dzenawagis Amanda | -- | None Available | |
| C A Welsch Kelley Ret | -- | None Available | |
| Welsch Kelly Cynthia A | $105,000 | -- | |
| Dzenaqagis Lynda | $125,000 | -- |
Source: Public Records
Mortgage History
| Date | Status | Borrower | Loan Amount |
|---|---|---|---|
| Previous Owner | Welsch Kelly Cynthia A | $107,100 | |
| Previous Owner | Dzenaqagis Lynda | $100,000 |
Source: Public Records
Tax History
| Year | Tax Paid | Tax Assessment Tax Assessment Total Assessment is a certain percentage of the fair market value that is determined by local assessors to be the total taxable value of land and additions on the property. | Land | Improvement |
|---|---|---|---|---|
| 2025 | $3,544 | $438,100 | $138,300 | $299,800 |
| 2024 | $3,402 | $435,600 | $138,300 | $297,300 |
| 2023 | $3,217 | $385,700 | $125,800 | $259,900 |
| 2022 | $3,067 | $318,200 | $93,200 | $225,000 |
| 2021 | $2,929 | $279,200 | $93,200 | $186,000 |
| 2020 | $2,978 | $271,700 | $93,200 | $178,500 |
| 2019 | $2,848 | $252,500 | $93,200 | $159,300 |
| 2018 | $1,107 | $229,600 | $98,100 | $131,500 |
| 2017 | $2,406 | $223,600 | $98,100 | $125,500 |
| 2016 | $2,502 | $229,500 | $104,000 | $125,500 |
| 2015 | $2,385 | $219,800 | $96,600 | $123,200 |
Source: Public Records
Map
Nearby Homes
- 21 Brian Ln
- 60 Richards Ln
- 101 Cottonwood Ln
- 357 Lakeside Dr W
- 522 Lincoln Road Extension
- 481 Lakeside Dr W
- 10 Sail -A-way
- 10 Sail a Way
- 75 Olander Dr
- 75 Olander Dr
- 66 Arrowhead Dr
- 365 Phinneys Ln
- 8 Captain Cook Ln Unit 8
- 8 Captain Cook Ln Unit 8
- 720 Pitchers Way Unit 52
- 720 Pitchers Way Unit 40
- 179 Sudbury Ln
- 800 Bearses Way Unit 2ED
- 800 Bearses Way Unit 2ED
- 800 Bearses Way Unit 2SB
- 15 Aurora Ave
- 26 Aurora Ave
- 26 Aurora Ave Unit 1
- 36 Wequaquet Ave
- 26 Wequaquet Ave
- 26 Wequaquet Ave
- 16 Aurora Ave
- 16 Wequaquet Ave
- 5 Aurora Ave
- 23 Laura Ave
- 758 Phinneys Ln
- 189 Longview Dr
- 183 Longview Dr
- 13 Laura Rd
- 13 Laura Ave
- 25 Wequaquet Ave
- 25 Wequaquet Ave
- 71 Wequaquet Ave
- 35 Wequaquet Ave
- 169 Longview Dr
Your Personal Tour Guide
Ask me questions while you tour the home.