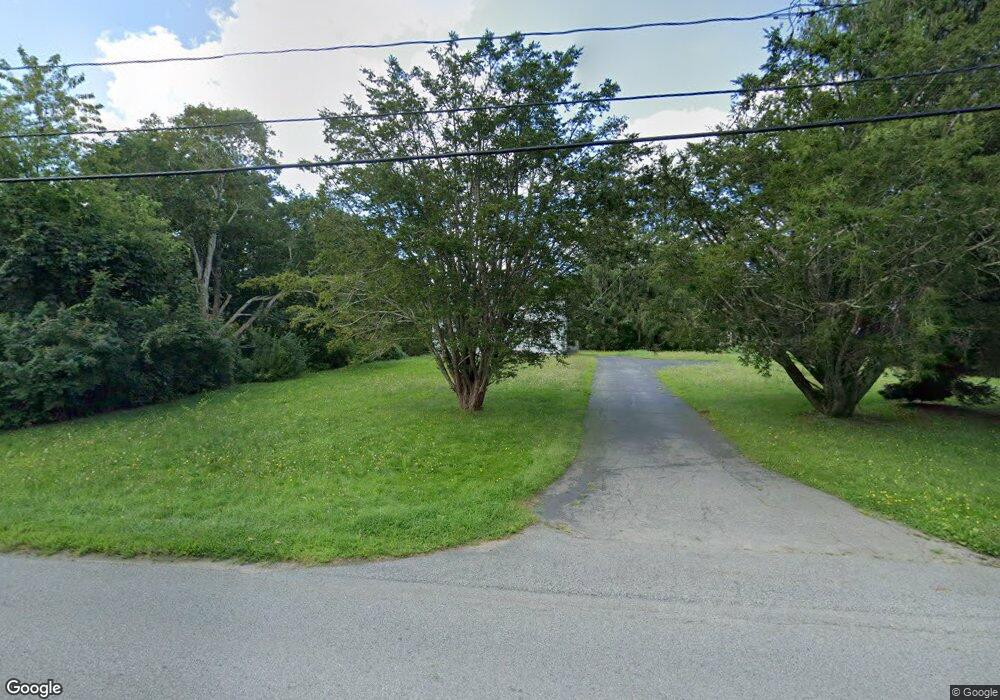
25 - B South Shore Rd Little Compton, RI 02837
Estimated Value: $603,000 - $1,025,000
3
Beds
2
Baths
2,089
Sq Ft
$391/Sq Ft
Est. Value
About This Home
This home is located at 25 - B South Shore Rd, Little Compton, RI 02837 and is currently estimated at $816,741, approximately $390 per square foot. 25 - B South Shore Rd is a home located in Newport County with nearby schools including Wilbur & McMahon School.
Ownership History
Date
Name
Owned For
Owner Type
Purchase Details
Closed on
Dec 22, 2016
Sold by
Borden 4Th Albert W and Borden Rachel E
Bought by
Drakes Richard and Drakes Andrea N
Current Estimated Value
Home Financials for this Owner
Home Financials are based on the most recent Mortgage that was taken out on this home.
Original Mortgage
$320,566
Interest Rate
3.57%
Mortgage Type
New Conventional
Purchase Details
Closed on
Nov 27, 2013
Sold by
Borden 3Rd Albert W and Borden Beryl R
Bought by
Borden 4Th Albert W and Borden Rachel E
Purchase Details
Closed on
Apr 8, 2011
Sold by
Citimortgage Inc
Bought by
Borden 3Rd Albert W and Borden Beryl R
Purchase Details
Closed on
Oct 15, 2009
Sold by
Citimortigage
Bought by
Borden Albert W and Borden Beryl R
Create a Home Valuation Report for This Property
The Home Valuation Report is an in-depth analysis detailing your home's value as well as a comparison with similar homes in the area
Home Values in the Area
Average Home Value in this Area
Purchase History
| Date | Buyer | Sale Price | Title Company |
|---|---|---|---|
| Drakes Richard | $260,000 | -- | |
| Borden 4Th Albert W | $220,000 | -- | |
| Borden 3Rd Albert W | -- | -- | |
| Borden Albert W | $200,000 | -- | |
| Drakes Richard | $260,000 | -- | |
| Borden 4Th Albert W | $220,000 | -- | |
| Borden 3Rd Albert W | -- | -- | |
| Borden Albert W | $200,000 | -- |
Source: Public Records
Mortgage History
| Date | Status | Borrower | Loan Amount |
|---|---|---|---|
| Open | Borden Albert W | $319,900 | |
| Closed | Borden Albert W | $320,566 |
Source: Public Records
Tax History Compared to Growth
Tax History
| Year | Tax Paid | Tax Assessment Tax Assessment Total Assessment is a certain percentage of the fair market value that is determined by local assessors to be the total taxable value of land and additions on the property. | Land | Improvement |
|---|---|---|---|---|
| 2025 | $2,147 | $448,300 | $221,800 | $226,500 |
| 2024 | $1,915 | $377,000 | $192,800 | $184,200 |
| 2023 | $1,870 | $377,000 | $192,800 | $184,200 |
| 2022 | $1,847 | $377,000 | $192,800 | $184,200 |
| 2021 | $2,076 | $343,700 | $167,800 | $175,900 |
| 2020 | $2,059 | $343,700 | $167,800 | $175,900 |
| 2019 | $2,038 | $343,700 | $167,800 | $175,900 |
| 2018 | $1,970 | $330,600 | $149,000 | $181,600 |
| 2016 | $1,622 | $286,000 | $149,000 | $137,000 |
| 2015 | $1,744 | $303,300 | $150,500 | $152,800 |
| 2014 | $1,711 | $303,300 | $150,500 | $152,800 |
Source: Public Records
Map
Nearby Homes
- 128 Maple Ave
- 141 S Of Commons Rd
- 18 Old Barn Rd
- 536 W Main Rd
- 189 Brayton Point Rd
- 304 Brayton Point Rd
- 0 Willow Ave
- 505 Long Hwy
- 255 John Dyer Rd
- 19 Seabury Ln
- 441 W Main Rd
- 245 John Dyer Rd
- 180 W Main Rd
- 17 Ferolbink Way
- 155 W Main Rd
- 83 Long Hwy
- 116 Amy Hart Path
- 6 June Way
- 55 W Main Rd
- 90 Two Rod Rd