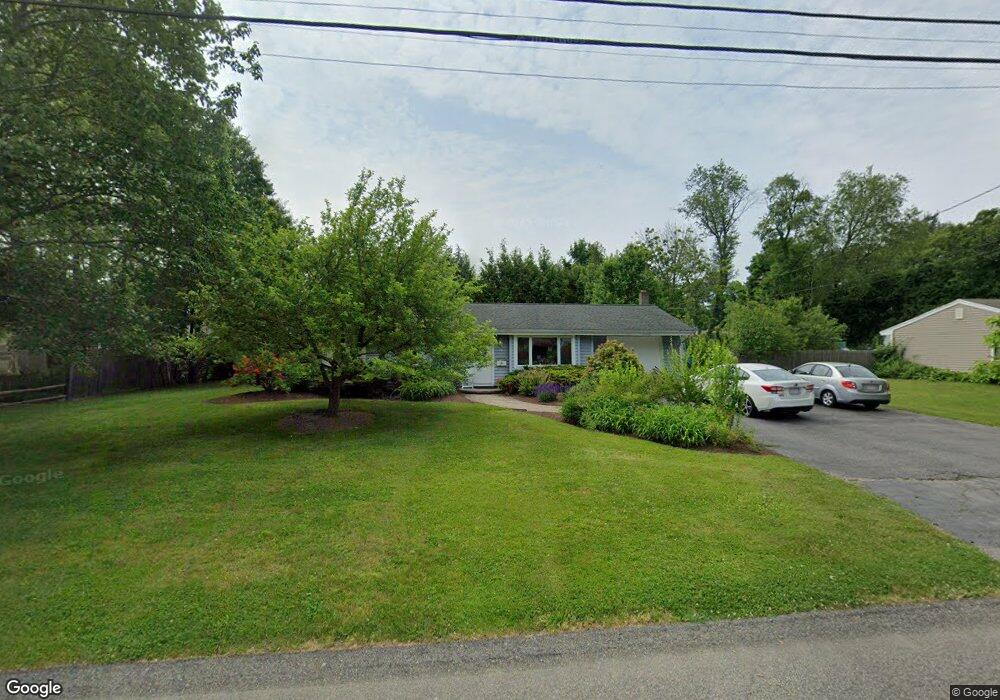
25 Backlund Dr Brockton, MA 02302
Estimated Value: $474,000 - $491,859
3
Beds
1
Bath
1,232
Sq Ft
$392/Sq Ft
Est. Value
About This Home
This home is located at 25 Backlund Dr, Brockton, MA 02302 and is currently estimated at $482,465, approximately $391 per square foot. 25 Backlund Dr is a home located in Plymouth County with nearby schools including Davis K-8 School, John F. Kennedy Elementary School, and South Middle School.
Ownership History
Date
Name
Owned For
Owner Type
Purchase Details
Closed on
Aug 31, 1998
Sold by
Spencer-Chapman K
Bought by
Kandis Ronald L and Kandis Denise E
Current Estimated Value
Home Financials for this Owner
Home Financials are based on the most recent Mortgage that was taken out on this home.
Original Mortgage
$97,850
Outstanding Balance
$20,902
Interest Rate
6.9%
Mortgage Type
Purchase Money Mortgage
Estimated Equity
$461,563
Purchase Details
Closed on
Apr 17, 1997
Sold by
Fhlmc
Bought by
Spencer-Chapman K
Home Financials for this Owner
Home Financials are based on the most recent Mortgage that was taken out on this home.
Original Mortgage
$77,208
Interest Rate
7.76%
Mortgage Type
Purchase Money Mortgage
Purchase Details
Closed on
Dec 23, 1996
Sold by
Dasilva Antonio M and Dasilva Fhlmc
Bought by
Fhlmc
Create a Home Valuation Report for This Property
The Home Valuation Report is an in-depth analysis detailing your home's value as well as a comparison with similar homes in the area
Home Values in the Area
Average Home Value in this Area
Purchase History
| Date | Buyer | Sale Price | Title Company |
|---|---|---|---|
| Kandis Ronald L | $103,000 | -- | |
| Spencer-Chapman K | $83,900 | -- | |
| Fhlmc | $65,000 | -- |
Source: Public Records
Mortgage History
| Date | Status | Borrower | Loan Amount |
|---|---|---|---|
| Open | Fhlmc | $40,000 | |
| Closed | Fhlmc | $40,000 | |
| Open | Fhlmc | $97,850 | |
| Previous Owner | Fhlmc | $77,208 |
Source: Public Records
Tax History Compared to Growth
Tax History
| Year | Tax Paid | Tax Assessment Tax Assessment Total Assessment is a certain percentage of the fair market value that is determined by local assessors to be the total taxable value of land and additions on the property. | Land | Improvement |
|---|---|---|---|---|
| 2025 | $4,836 | $399,300 | $162,300 | $237,000 |
| 2024 | $4,623 | $384,600 | $162,300 | $222,300 |
| 2023 | $4,457 | $343,400 | $112,600 | $230,800 |
| 2022 | $4,124 | $295,200 | $102,400 | $192,800 |
| 2021 | $4,117 | $283,900 | $95,700 | $188,200 |
| 2020 | $4,031 | $266,100 | $83,700 | $182,400 |
| 2019 | $3,726 | $239,800 | $80,200 | $159,600 |
| 2018 | $3,509 | $218,500 | $80,200 | $138,300 |
| 2017 | $2,972 | $184,600 | $80,200 | $104,400 |
| 2016 | $3,151 | $181,500 | $76,400 | $105,100 |
| 2015 | $2,779 | $153,100 | $76,400 | $76,700 |
| 2014 | $2,894 | $159,600 | $76,400 | $83,200 |
Source: Public Records
Map
Nearby Homes