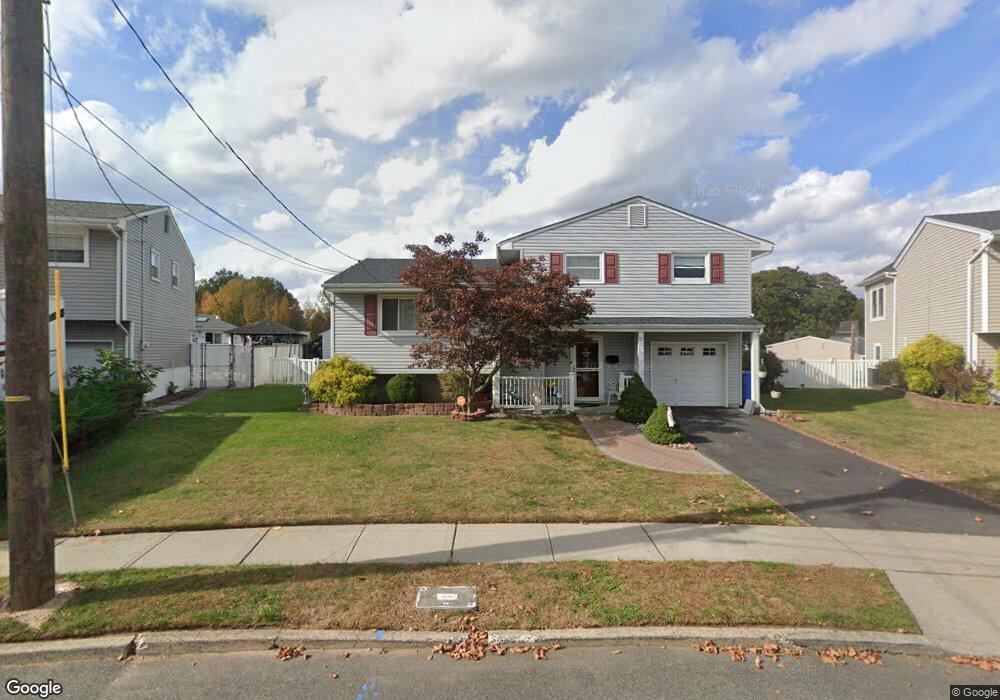
25 Bayberry Ct Port Reading, NJ 07064
Estimated Value: $406,470 - $629,000
3
Beds
2
Baths
1
Sq Ft
$557,868/Sq Ft
Est. Value
About This Home
This home is located at 25 Bayberry Ct, Port Reading, NJ 07064 and is currently estimated at $557,868, approximately $557,868 per square foot. 25 Bayberry Ct is a home located in Middlesex County with nearby schools including Port Reading Elementary School, Avenel Middle School, and Woodbridge High School.
Ownership History
Date
Name
Owned For
Owner Type
Purchase Details
Closed on
Apr 29, 2010
Sold by
Messih Milad and Abdalla Hanan
Bought by
Messih Milad and Messih Hanan
Current Estimated Value
Home Financials for this Owner
Home Financials are based on the most recent Mortgage that was taken out on this home.
Original Mortgage
$249,300
Outstanding Balance
$166,945
Interest Rate
5.11%
Mortgage Type
New Conventional
Estimated Equity
$390,923
Purchase Details
Closed on
Jul 30, 2008
Sold by
Manor Homes Llc
Bought by
Messih Milad and Abdalla Hanan
Home Financials for this Owner
Home Financials are based on the most recent Mortgage that was taken out on this home.
Original Mortgage
$247,500
Interest Rate
6.49%
Mortgage Type
Purchase Money Mortgage
Purchase Details
Closed on
Apr 15, 2008
Sold by
Demarc Mary M and Carlucci Claire
Bought by
Manor Homes Llc
Create a Home Valuation Report for This Property
The Home Valuation Report is an in-depth analysis detailing your home's value as well as a comparison with similar homes in the area
Home Values in the Area
Average Home Value in this Area
Purchase History
| Date | Buyer | Sale Price | Title Company |
|---|---|---|---|
| Messih Milad | -- | Montgomery Hills Title Svcs | |
| Messih Milad | $330,000 | Old Republic National Title | |
| Manor Homes Llc | $245,000 | None Available |
Source: Public Records
Mortgage History
| Date | Status | Borrower | Loan Amount |
|---|---|---|---|
| Open | Messih Milad | $249,300 | |
| Closed | Messih Milad | $247,500 |
Source: Public Records
Tax History Compared to Growth
Tax History
| Year | Tax Paid | Tax Assessment Tax Assessment Total Assessment is a certain percentage of the fair market value that is determined by local assessors to be the total taxable value of land and additions on the property. | Land | Improvement |
|---|---|---|---|---|
| 2025 | $9,819 | $73,700 | $21,000 | $52,700 |
| 2024 | $9,533 | $73,700 | $21,000 | $52,700 |
| 2023 | $9,533 | $73,700 | $21,000 | $52,700 |
| 2022 | $9,297 | $73,700 | $21,000 | $52,700 |
| 2021 | $8,923 | $73,700 | $21,000 | $52,700 |
| 2020 | $8,625 | $73,700 | $21,000 | $52,700 |
| 2019 | $8,380 | $73,700 | $21,000 | $52,700 |
| 2018 | $8,210 | $73,700 | $21,000 | $52,700 |
| 2017 | $8,045 | $73,700 | $21,000 | $52,700 |
| 2016 | $7,965 | $73,700 | $21,000 | $52,700 |
| 2015 | $7,800 | $73,700 | $21,000 | $52,700 |
| 2014 | $7,599 | $73,700 | $21,000 | $52,700 |
Source: Public Records
Map
Nearby Homes