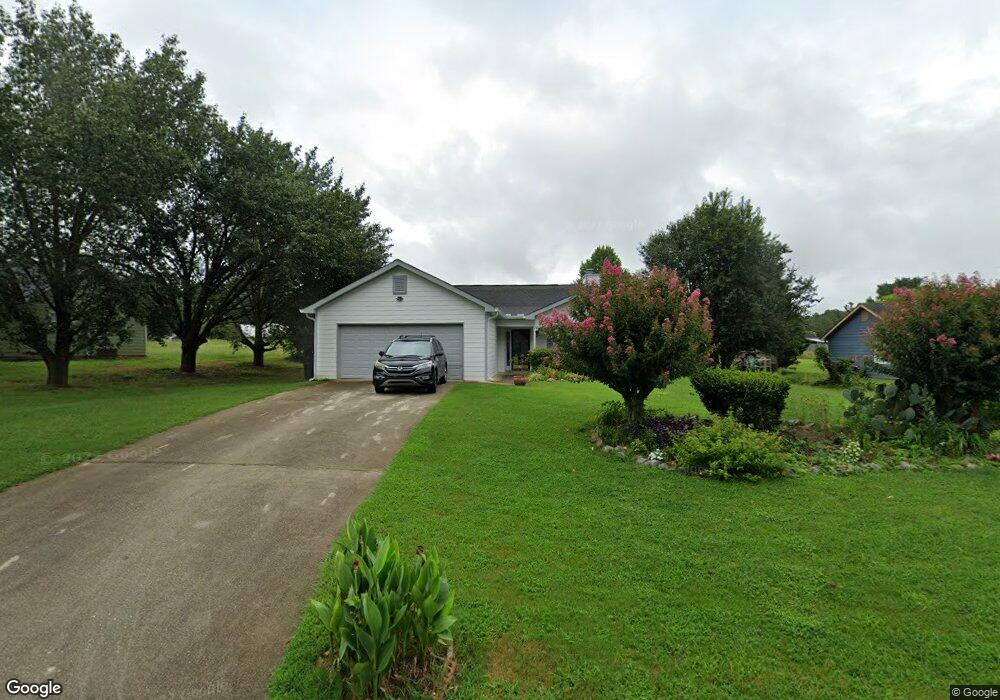
25 Belmont Cove Unit 1 Covington, GA 30016
Estimated Value: $246,691 - $260,000
3
Beds
2
Baths
1,322
Sq Ft
$192/Sq Ft
Est. Value
About This Home
This home is located at 25 Belmont Cove Unit 1, Covington, GA 30016 and is currently estimated at $254,173, approximately $192 per square foot. 25 Belmont Cove Unit 1 is a home located in Newton County with nearby schools including Livingston Elementary School, Liberty Middle School, and Alcovy High School.
Ownership History
Date
Name
Owned For
Owner Type
Purchase Details
Closed on
Sep 29, 2016
Sold by
Bryant Jacqueline M
Bought by
Francis Ann Marie R
Current Estimated Value
Home Financials for this Owner
Home Financials are based on the most recent Mortgage that was taken out on this home.
Original Mortgage
$92,297
Outstanding Balance
$73,781
Interest Rate
3.37%
Mortgage Type
FHA
Estimated Equity
$180,392
Purchase Details
Closed on
Nov 19, 2002
Sold by
Wachovia Bk Na
Bought by
Bryant Jacqueline M
Home Financials for this Owner
Home Financials are based on the most recent Mortgage that was taken out on this home.
Original Mortgage
$99,900
Interest Rate
6.07%
Mortgage Type
New Conventional
Purchase Details
Closed on
Apr 2, 2002
Sold by
Meadows Carroll A and Meadows Deborah R
Bought by
First Union Nat'L Bk
Purchase Details
Closed on
Nov 2, 1995
Sold by
Lanier Mote Bldrs Inc
Bought by
Meadows Carroll A Deborah
Purchase Details
Closed on
Jan 23, 1995
Sold by
Brookhaven Deve Lopment Inc
Bought by
Lanier Mote Bui Lders John Davies
Create a Home Valuation Report for This Property
The Home Valuation Report is an in-depth analysis detailing your home's value as well as a comparison with similar homes in the area
Home Values in the Area
Average Home Value in this Area
Purchase History
| Date | Buyer | Sale Price | Title Company |
|---|---|---|---|
| Francis Ann Marie R | $94,000 | -- | |
| Bryant Jacqueline M | $100,000 | -- | |
| First Union Nat'L Bk | -- | -- | |
| Meadows Carroll A Deborah | $78,500 | -- | |
| Lanier Mote Bui Lders John Davies | $12,400 | -- |
Source: Public Records
Mortgage History
| Date | Status | Borrower | Loan Amount |
|---|---|---|---|
| Open | Francis Ann Marie R | $92,297 | |
| Previous Owner | Bryant Jacqueline M | $99,900 | |
| Closed | Lanier Mote Bui Lders John Davies | $0 |
Source: Public Records
Tax History Compared to Growth
Tax History
| Year | Tax Paid | Tax Assessment Tax Assessment Total Assessment is a certain percentage of the fair market value that is determined by local assessors to be the total taxable value of land and additions on the property. | Land | Improvement |
|---|---|---|---|---|
| 2024 | $1,449 | $97,080 | $14,800 | $82,280 |
| 2023 | $1,622 | $87,200 | $8,800 | $78,400 |
| 2022 | $1,100 | $67,960 | $8,800 | $59,160 |
| 2021 | $759 | $52,720 | $8,800 | $43,920 |
| 2020 | $660 | $47,600 | $8,000 | $39,600 |
| 2019 | $641 | $46,760 | $8,000 | $38,760 |
| 2018 | $1,387 | $39,160 | $5,200 | $33,960 |
| 2017 | $1,263 | $35,560 | $5,200 | $30,360 |
| 2016 | $66 | $27,120 | $4,000 | $23,120 |
| 2015 | $65 | $25,720 | $3,200 | $22,520 |
| 2014 | $56 | $16,160 | $0 | $0 |
Source: Public Records
Map
Nearby Homes
- 40 Belmont Cir Unit 2
- 230 Belmont Trail
- 110 Collingwood Landing
- 245 Belmont Trail
- 70 Cowan Ridge
- 15 Glen Echo Dr
- 472 Oak Hill Rd
- 335 Glen Echo Dr
- 35 Green Hill Ct
- 66 Ellis Trail
- 25 Castlehill Ct
- 75 Oak Hill Dr
- 190 Oak Hill Cir
- 455 Bethany Rd
- 255 Countryside Ln
- 115 Branchwood Dr
- 205 Woodcrest Dr
- 30 Oak Wood Ln
- 25 Belmont Cove
- 15 Belmont Cove
- 35 Belmont Cove
- 45 Belmont Cove
- 95 Belmont Trail
- 105 Belmont Trail
- 20 Belmont Cove
- 115 Belmont Trail
- 140 Belmont Trail
- 85 Belmont Trail
- 10 Belmont Cove Unit 115
- 10 Belmont Cove
- 30 Belmont Cove
- 75 Belmont Trail
- 40 Belmont Cove Unit /106
- 40 Belmont Cove
- 125 Belmont Trail
- 25 Belmont Ct
- 150 Belmont Trail
- 65 Belmont Trail