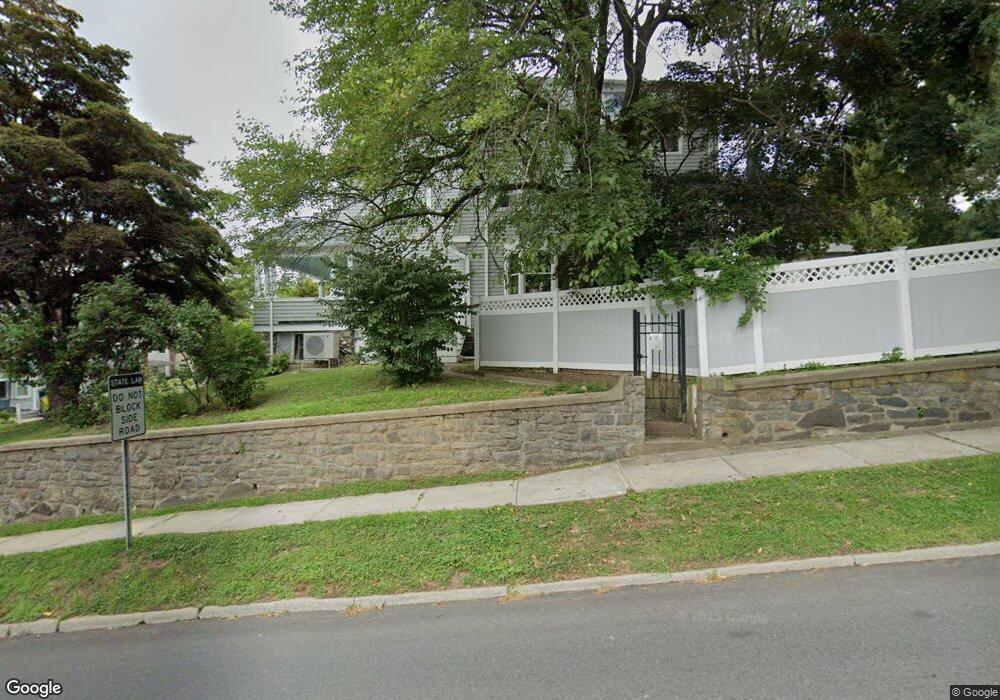
25 Benedict Ave Unit 1 Tarrytown, NY 10591
Estimated Value: $1,534,000 - $1,855,000
--
Bed
2
Baths
4,580
Sq Ft
$362/Sq Ft
Est. Value
About This Home
This home is located at 25 Benedict Ave Unit 1, Tarrytown, NY 10591 and is currently estimated at $1,659,321, approximately $362 per square foot. 25 Benedict Ave Unit 1 is a home located in Westchester County with nearby schools including Washington Irving Interm School, John Paulding School, and W L Morse School.
Ownership History
Date
Name
Owned For
Owner Type
Purchase Details
Closed on
Aug 30, 2022
Sold by
Siravo Matthew J and Cuczzo Christina A
Bought by
Glover Thomas E and Glover Liza P
Current Estimated Value
Purchase Details
Closed on
Aug 7, 2009
Sold by
Dilthey Michael and Dilthey Ellen
Bought by
Siravo Matthew J and Cuozzo Christina A
Home Financials for this Owner
Home Financials are based on the most recent Mortgage that was taken out on this home.
Original Mortgage
$488,000
Interest Rate
5.19%
Mortgage Type
New Conventional
Purchase Details
Closed on
Apr 7, 2006
Sold by
Walsh Carol Lynn and Walsh Dorothy Lee
Bought by
Dilthey Michael and Dilthey Ellen
Home Financials for this Owner
Home Financials are based on the most recent Mortgage that was taken out on this home.
Original Mortgage
$650,000
Interest Rate
6.37%
Mortgage Type
Unknown
Create a Home Valuation Report for This Property
The Home Valuation Report is an in-depth analysis detailing your home's value as well as a comparison with similar homes in the area
Home Values in the Area
Average Home Value in this Area
Purchase History
| Date | Buyer | Sale Price | Title Company |
|---|---|---|---|
| Glover Thomas E | $1,270,000 | Titlepro | |
| Glover Thomas E | $1,270,000 | Title Pro Agency Llc | |
| Siravo Matthew J | $610,000 | Rels Title Insurance | |
| Dilthey Michael | $821,000 | First American Title Ins Co |
Source: Public Records
Mortgage History
| Date | Status | Borrower | Loan Amount |
|---|---|---|---|
| Previous Owner | Siravo Matthew J | $488,000 | |
| Previous Owner | Dilthey Michael | $650,000 |
Source: Public Records
Tax History Compared to Growth
Tax History
| Year | Tax Paid | Tax Assessment Tax Assessment Total Assessment is a certain percentage of the fair market value that is determined by local assessors to be the total taxable value of land and additions on the property. | Land | Improvement |
|---|---|---|---|---|
| 2024 | $37,925 | $1,468,200 | $302,600 | $1,165,600 |
| 2023 | $32,864 | $1,202,600 | $220,900 | $981,700 |
| 2022 | $30,844 | $1,030,300 | $201,000 | $829,300 |
| 2021 | $29,316 | $916,800 | $201,000 | $715,800 |
| 2020 | $29,121 | $845,300 | $223,100 | $622,200 |
| 2019 | $27,931 | $845,300 | $223,100 | $622,200 |
| 2018 | $32,978 | $822,500 | $223,100 | $599,400 |
| 2017 | $16,629 | $784,400 | $223,100 | $561,300 |
| 2016 | $558,827 | $761,600 | $223,100 | $538,500 |
| 2015 | -- | $17,850 | $3,500 | $14,350 |
| 2014 | -- | $17,850 | $3,500 | $14,350 |
| 2013 | $16,982 | $17,850 | $3,500 | $14,350 |
Source: Public Records
Map
Nearby Homes
- 20 Benedict Ave
- 19 S Broadway Unit 4A
- 12 Hendrick Ln Unit 43E
- 26 Bridge St
- 18 N Broadway Unit 411
- 300 S Broadway Unit 1C
- 14 Croton Ave
- 320 S Broadway Unit N9
- 320 S Broadway Unit T2
- 320 S Broadway Unit P8
- 320 S Broadway Unit R12
- 154 Martling Ave Unit 5-J6
- 102 Legend Dr Unit 101
- 330 S Broadway Unit H4
- 29 Dixon St
- 497 Martling Ave
- 127 W Main St Unit 300
- 127 W Main St Unit S200
- 29 Woodland Ave
- 94 Barnes Rd
- 25 Benedict Ave
- 116 Grove St Unit 1
- 116 Grove St Unit 2nd flr.
- 116 Grove St
- 144 Grove St
- 110 Grove St
- 123 Grove St
- 121 Grove St
- 146 Grove St
- 34 Benedict Ave Unit 2nd f
- 34 Benedict Ave
- 119 Grove St
- 117 Grove St
- 45 Benedict Ave
- 148 Grove St
- 20 Benedict Ave Unit 2
- 11 Benedict Ave
- 115 Grove St
- 0 Grove St Unit 2820750
- 104 Grove St