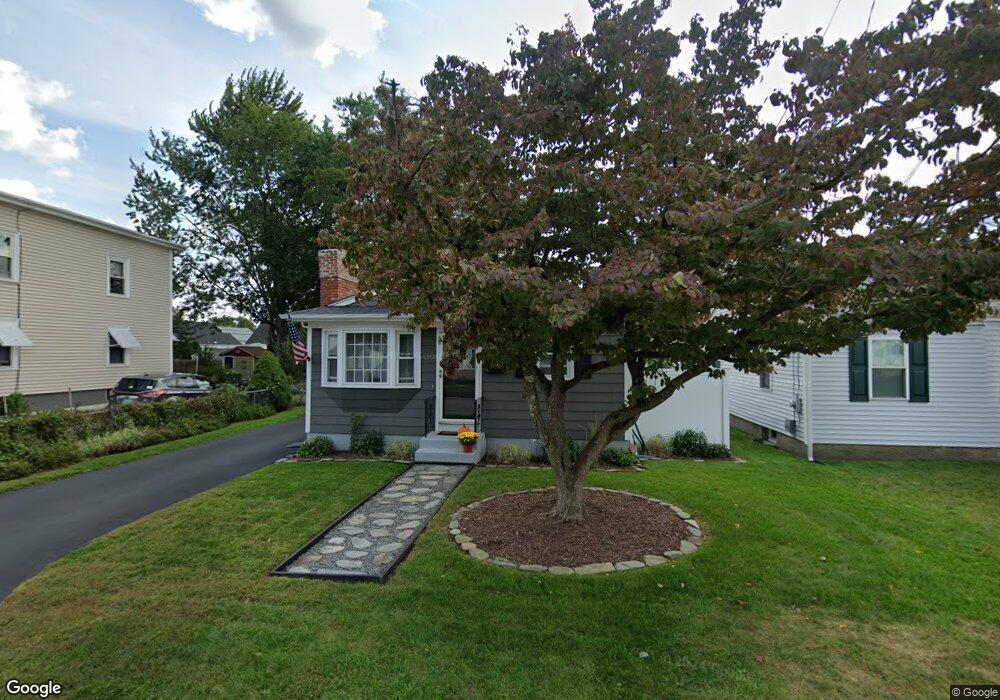
25 Benedict St Pawtucket, RI 02861
Darlington NeighborhoodEstimated Value: $384,000 - $403,329
3
Beds
1
Bath
1,998
Sq Ft
$198/Sq Ft
Est. Value
About This Home
This home is located at 25 Benedict St, Pawtucket, RI 02861 and is currently estimated at $396,332, approximately $198 per square foot. 25 Benedict St is a home located in Providence County with nearby schools including Saint Teresa Catholic Elementary School, St Cecilia School, and Saint Raphael Academy.
Ownership History
Date
Name
Owned For
Owner Type
Purchase Details
Closed on
Jul 30, 1997
Sold by
Faubert Alfred A and Faubert Anastasia
Bought by
Etchells James S and Etchells Melissa
Current Estimated Value
Create a Home Valuation Report for This Property
The Home Valuation Report is an in-depth analysis detailing your home's value as well as a comparison with similar homes in the area
Home Values in the Area
Average Home Value in this Area
Purchase History
| Date | Buyer | Sale Price | Title Company |
|---|---|---|---|
| Etchells James S | $89,000 | -- |
Source: Public Records
Mortgage History
| Date | Status | Borrower | Loan Amount |
|---|---|---|---|
| Open | Etchells James S | $75,000 | |
| Closed | Etchells James S | $45,000 |
Source: Public Records
Tax History
| Year | Tax Paid | Tax Assessment Tax Assessment Total Assessment is a certain percentage of the fair market value that is determined by local assessors to be the total taxable value of land and additions on the property. | Land | Improvement |
|---|---|---|---|---|
| 2025 | $4,313 | $328,000 | $128,100 | $199,900 |
| 2024 | $4,048 | $328,000 | $128,100 | $199,900 |
| 2023 | $4,299 | $253,800 | $86,100 | $167,700 |
| 2022 | $4,208 | $253,800 | $86,100 | $167,700 |
| 2021 | $4,208 | $253,800 | $86,100 | $167,700 |
| 2020 | $4,176 | $199,900 | $71,200 | $128,700 |
| 2019 | $4,176 | $199,900 | $71,200 | $128,700 |
| 2018 | $4,024 | $199,900 | $71,200 | $128,700 |
| 2017 | $3,626 | $159,600 | $64,900 | $94,700 |
| 2016 | $3,494 | $159,600 | $64,900 | $94,700 |
| 2015 | $3,494 | $159,600 | $64,900 | $94,700 |
| 2014 | $3,316 | $143,800 | $61,900 | $81,900 |
Source: Public Records
Map
Nearby Homes
Your Personal Tour Guide
Ask me questions while you tour the home.