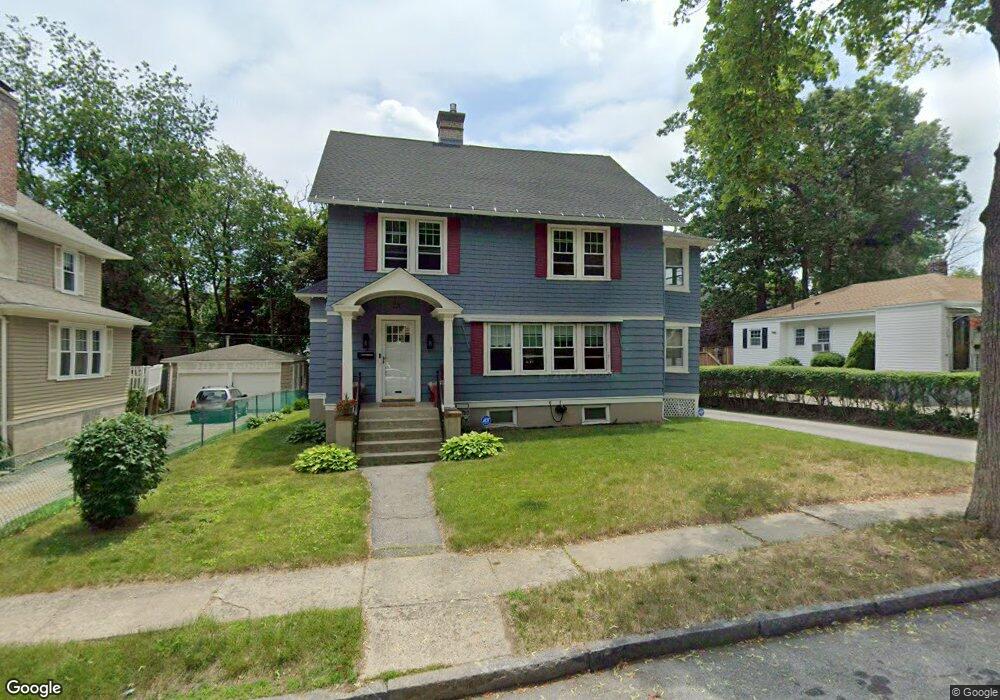
25 Berkmans St Worcester, MA 01602
Elm Park NeighborhoodEstimated Value: $569,000 - $638,000
7
Beds
2
Baths
2,854
Sq Ft
$211/Sq Ft
Est. Value
About This Home
This home is located at 25 Berkmans St, Worcester, MA 01602 and is currently estimated at $603,166, approximately $211 per square foot. 25 Berkmans St is a home located in Worcester County with nearby schools including Chandler Magnet, Jacob Hiatt Magnet School, and Midland Street.
Ownership History
Date
Name
Owned For
Owner Type
Purchase Details
Closed on
Apr 17, 1998
Sold by
Est Germain Thomas Jr and Johnson Hilary J
Bought by
Weekes Walter J and Weekes Janice I
Current Estimated Value
Create a Home Valuation Report for This Property
The Home Valuation Report is an in-depth analysis detailing your home's value as well as a comparison with similar homes in the area
Home Values in the Area
Average Home Value in this Area
Purchase History
| Date | Buyer | Sale Price | Title Company |
|---|---|---|---|
| Weekes Walter J | $130,000 | -- |
Source: Public Records
Mortgage History
| Date | Status | Borrower | Loan Amount |
|---|---|---|---|
| Open | Weekes Walter J | $50,000 | |
| Open | Weekes Walter J | $160,000 | |
| Closed | Weekes Walter J | $105,000 | |
| Closed | Weekes Walter J | $24,000 |
Source: Public Records
Tax History Compared to Growth
Tax History
| Year | Tax Paid | Tax Assessment Tax Assessment Total Assessment is a certain percentage of the fair market value that is determined by local assessors to be the total taxable value of land and additions on the property. | Land | Improvement |
|---|---|---|---|---|
| 2025 | $6,387 | $484,200 | $117,900 | $366,300 |
| 2024 | $6,243 | $454,000 | $117,900 | $336,100 |
| 2023 | $6,020 | $419,800 | $102,500 | $317,300 |
| 2022 | $5,587 | $367,300 | $82,100 | $285,200 |
| 2021 | $5,517 | $338,900 | $65,600 | $273,300 |
| 2020 | $5,338 | $314,000 | $65,600 | $248,400 |
| 2019 | $5,346 | $297,000 | $59,000 | $238,000 |
| 2018 | $5,293 | $279,900 | $59,000 | $220,900 |
| 2017 | $5,184 | $269,700 | $59,000 | $210,700 |
| 2016 | $5,346 | $259,400 | $43,000 | $216,400 |
| 2015 | $5,206 | $259,400 | $43,000 | $216,400 |
| 2014 | $5,069 | $259,400 | $43,000 | $216,400 |
Source: Public Records
Map
Nearby Homes