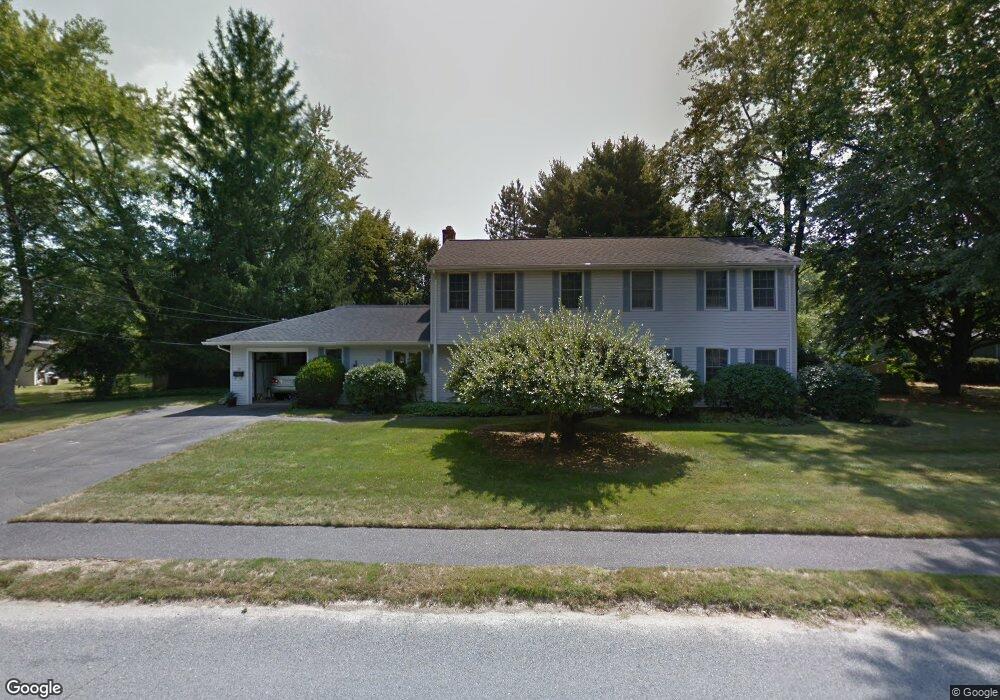
25 Bradford Rd Natick, MA 01760
Estimated Value: $1,070,000 - $1,199,390
6
Beds
4
Baths
2,582
Sq Ft
$438/Sq Ft
Est. Value
About This Home
This home is located at 25 Bradford Rd, Natick, MA 01760 and is currently estimated at $1,130,848, approximately $437 per square foot. 25 Bradford Rd is a home located in Middlesex County with nearby schools including Natick High School, Bennett-Hemenway (Ben-Hem) Elementary School, and Wilson Middle School.
Ownership History
Date
Name
Owned For
Owner Type
Purchase Details
Closed on
Feb 10, 2020
Sold by
Powell Lt
Bought by
Bell Douglas and Bell Sarah A
Current Estimated Value
Home Financials for this Owner
Home Financials are based on the most recent Mortgage that was taken out on this home.
Original Mortgage
$350,000
Outstanding Balance
$310,721
Interest Rate
3.74%
Mortgage Type
New Conventional
Estimated Equity
$820,127
Purchase Details
Closed on
Jul 13, 2016
Sold by
Powell Peter A and Powell Joan E
Bought by
Powell Lt
Purchase Details
Closed on
Aug 15, 1975
Bought by
Powell Peter A and Powell Joan E
Create a Home Valuation Report for This Property
The Home Valuation Report is an in-depth analysis detailing your home's value as well as a comparison with similar homes in the area
Home Values in the Area
Average Home Value in this Area
Purchase History
| Date | Buyer | Sale Price | Title Company |
|---|---|---|---|
| Bell Douglas | $350,000 | None Available | |
| Powell Lt | -- | -- | |
| Powell Peter A | -- | -- |
Source: Public Records
Mortgage History
| Date | Status | Borrower | Loan Amount |
|---|---|---|---|
| Open | Bell Douglas | $350,000 | |
| Previous Owner | Powell Peter A | $160,000 |
Source: Public Records
Tax History
| Year | Tax Paid | Tax Assessment Tax Assessment Total Assessment is a certain percentage of the fair market value that is determined by local assessors to be the total taxable value of land and additions on the property. | Land | Improvement |
|---|---|---|---|---|
| 2025 | $11,593 | $969,300 | $463,100 | $506,200 |
| 2024 | $11,175 | $911,500 | $437,400 | $474,100 |
| 2023 | $10,734 | $849,200 | $410,400 | $438,800 |
| 2022 | $10,479 | $785,500 | $373,500 | $412,000 |
| 2021 | $9,115 | $669,700 | $353,000 | $316,700 |
| 2020 | $8,906 | $654,400 | $337,700 | $316,700 |
| 2019 | $8,317 | $654,400 | $337,700 | $316,700 |
| 2018 | $8,289 | $635,200 | $307,000 | $328,200 |
| 2017 | $8,040 | $596,000 | $273,700 | $322,300 |
| 2016 | $7,843 | $578,000 | $258,700 | $319,300 |
| 2015 | $7,619 | $551,300 | $258,700 | $292,600 |
Source: Public Records
Map
Nearby Homes
- 8 Liberty St
- 5 Bradford Rd
- 4 Richard Rd
- 29 Irving Rd
- 1 Richard Rd
- 25 Irving Rd
- 50 Wethersfield Rd
- 278 N Main St
- 8 Arlington Cir
- 340 N Main St
- 37 Longfellow Rd
- 6 Ash St
- 5 Haven Ln
- 26 Longfellow Rd
- 136 Commonwealth Rd
- 5 Griffin Cir
- 201 Willow Brook Dr
- 293 Bacon St Unit A
- 7 Westwood Rd
- 7 Jackson Ct Unit B
Your Personal Tour Guide
Ask me questions while you tour the home.